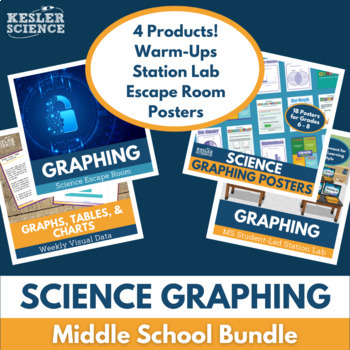
Science Graphing Bundle for Middle School - Graphs, Math Integration

What educators are saying
Products in this Bundle (4)
Description
Get ready to integrate science and engineering practices into your lessons with this middle school science graphing bundle! Increase your students’ comfort level with the types of graphing questions they’re likely to face in end-of-year testing.
The Middle School Science Graphing Bundle helps students learn how to:
- create graphs, charts, and tables
- organize and analyze data
- identify trends, patterns, and relationships
Included in this bundle:
Science Graphing Poster Set - 18 colorful and informative posters with vocabulary, examples, and explanations for seven types of graphs. Plus, you can engage your students with an interactive poster where they identify different parts of a graph by using cut and stick tags.
Graphs, Charts, & Tables - Weekly Visual Data - 35 weekly topics, each broken into five parts. Students can complete each part throughout the week as a 5-10 minute warm-up or do the entire activity within one 40-45 minute period. Every topic includes a phenomenon to consider, data to analyze, student-generated questions, and student-created graphs.
Graphing Station Lab - Eight modular stations offer students insight into different graphing activities where they learn all about independent and dependent variables and creating line, bar, and pie/circle graphs. This differentiated graphing lesson plan includes a modified reading passage and a Spanish version of the reading passage, plus a bonus Challenge station to keep your early finishers engaged.
Graphing Escape Room - Why not review your graphing unit with an immersive experience for your students? The graphing escape room has eight modular puzzles that allow students to demonstrate their knowledge of graphing, dependent variables, and independent variables in a fun and engaging format.
Save 20% with the bundle over purchasing these titles individually.
Terms of Use
Copyright © Kesler Science, LLC. All rights reserved by the author. This product is to be used by the original downloader only. Copying for more than one teacher, classroom, department, school, or school system is prohibited. Permission is never granted to enter Kesler Science materials into any form of AI for any purpose. This product may not be distributed or displayed digitally for public view. Failure to comply is copyright infringement and a violation of the Digital Millennium Copyright Act (DMCA). Clipart and elements found in this PDF are copyrighted and cannot be extracted and used outside of this file without permission or license. Intended for classroom and personal use ONLY. Multiple licenses are available for purchase by departments, schools, or school districts. Contact chris@keslerscience.com for more information.


