Scatter Plot Review, Study Guide, Test - Algebra - No Prep
- PPTX
Description
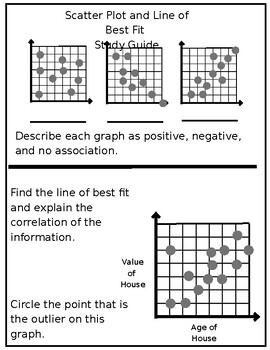
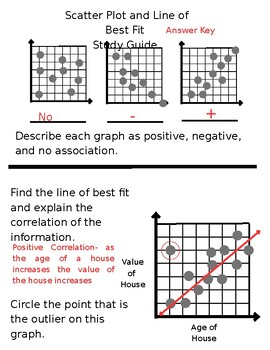
Introducing our comprehensive Scatterplot and Line of Best Fit Study Guide, Test, and Review Activity, designed specifically for teachers and their Algebra 1 and 2 students. This educational resource is ideal for teaching the key concept of scatterplot points.
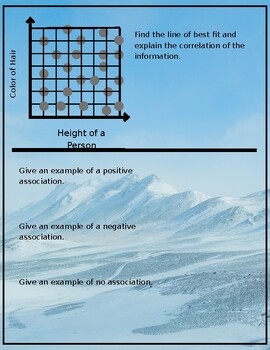
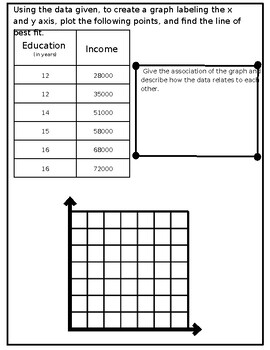
The study guide offers a concise yet comprehensive overview of scatterplots, emphasizing data interpretation and the process of drawing a line of best fit. Students will receive step-by-step guidance on creating accurate scatterplots and constructing lines of best fit.
Included is a test that assesses students' understanding of scatterplot and line of best fit concepts. The test includes various question types to accommodate different learning styles and abilities. This resource is designed to be inclusive, with content adapted for ESL and Special Education students. It uses simplified language and provides additional support as needed.
Additionally, a engaging review activity is included to reinforce learning. Students will participate in interactive exercises that strengthen their ability to analyze scatterplot data and draw valid conclusions.
Equip your students with the necessary tools to excel in scatterplot analysis with our all-inclusive Study Guide, Test, and Review Activity. Spark their curiosity, promote critical thinking, and foster a solid foundation in data interpretation.


