STEM Air Pollution Personal Survey DATA GRAPHING ACTIVITY MS-ESS3-3 EARTH DAY
- PPTX
- Excel Spreadsheets
Also included in
- 10 stem projects for middle school or higher that are physical science, life science or environmental science. All of the projects are highly structured. Most have rubrics and have detailed directions and reflection questions. Please view the preview for details. Included in this bundle:STEM WatePrice $32.80Original Price $41.00Save $8.20
- Here is my 2-3 week unit bundle for teaching Human Impact and Earth Day as part of MS-ESS3-3, MS-LS2-3 and MS-LS2-4. Easy prep activities. There is a detailed pacing guide that also includes links to my blog posts that helps you build out each activity. Please see the detailed preview.Topics IncludePrice $51.80Original Price $64.75Save $12.95
- Here is a bundle of three STEM activities for MS-ESS3-3 which covers human activity and environmental impact. The first resource involves the students building their own water filter with materials that they gather. The second addresses excess packaging on products and the amount of waste that goesPrice $9.50Original Price $11.00Save $1.50
- After teaching science for over 30 years, I finally put together my middle school and upper elementary ecology and environmental science, ecosystems, food chains and webs, biodiversity, Earth Day, STEM and CER resources! Click on the preview for complete details!The resources range from interactivePrice $252.60Original Price $315.75Save $63.15
- 11 interactive activities dealing with the impact of humans on the environment that are super for Earth Day and MS-ESS3-3. Included in this bundle:STEM Design a Water FilterMicroorganisms as Bioindicators of Water Pollution Reference CardsSTEM Air Pollution Graphing ActivityExcess Product PackaginPrice $35.60Original Price $44.50Save $8.90
Description
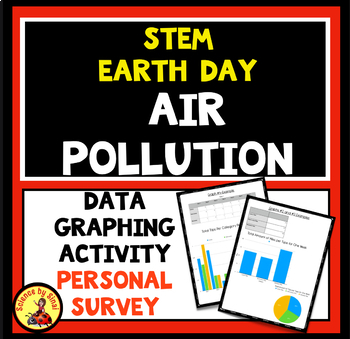
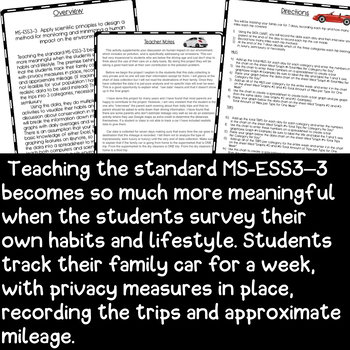
Middle school data graphing activity for students to learn about their own impact on air pollution. The activity involves tracking their family car for a week, with privacy measures in place, recording their trips and approximate mileage.
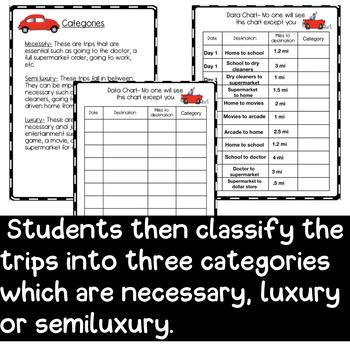
Note: If tracking the family car is not feasible for your population, I have included realistic data to be used instead. They then classify the trips into 3 categories; necessary, luxury or semiluxury.
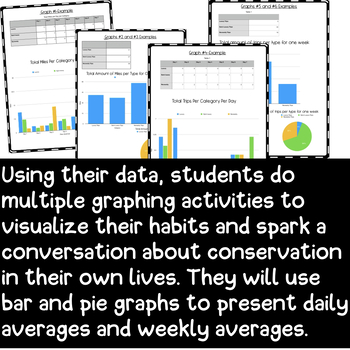
Using this data, they do multiple graphing activities to visualize their habits and spark a discussion about conservation in their own lives. They will break the information down into bar and pie graphs with daily averages and weekly averages. There is an assumption that your students have a basic knowledge of either Excel, Numbers or the graphing features on Keynote, so that they can enter the data into a spreadsheet to make the charts.
Included in this resource:
- Teacher Notes
- Categories of Types of Car Trips
- Data Chart(Private)
- Sample Data Chart for any student to use
- Student Directions
- Graph #1 Example and Directions “Total Miles Per Category Per Day” BAR GRAPH
- Graph #2 and #3 Example and Directions “Total Amount of Miles Per Type for One Week” BAR AND PIE GRAPHS
- Graph #4 Example and Directions “Total Trips Per Day” BAR GRAPH
- Graph #6 Example and Directions “ Total Amount of Trips Per Type in One Week” BAR AND PIE GRAPHS
- Extension/ Extra Credit
****Please check out my blog where I describe how I use this and other Earth Day and environmental resources. I also give away lots of science freebie resources.
Teaching Students About Their Individual Affect on Air Pollution
10 Environmental Earth Day Activities
Are you looking for other science resources? NGSS aligned activities? Science classroom decor or clip art? Please check out the rest of my store at SCIENCE BY SINAI.
https://www.teacherspayteachers.com/Store/Science-By-Sinai
Follow Me
Do you want to be the first to find out when I post a new resource? Please click on the green star next to my name to FOLLOW MY STORE, SCIENCE BY SINAI, and to get an email each time I post a new product. As a follower you will also get notifications of freebies and sales!
Check me out on social media.
https://www.pinterest.com/karensinai2/
https://www.instagram.com/sciencebysinai/
https://www.facebook.com/Science-by-Sinai
Feedback
**Did you know that you can save money on TpT resources by leaving feedback? Go to your “My Purchases“ page and leave feedback on the resources you’ve purchased to earn TpT credits!
Copyright.
Each purchase is a license for ONE person to use in a classroom setting. It is a violation for individuals, schools and districts to redistribute, edit, sell, or post this item on the Internet or to other individuals. Disregarding the copyright is a violation of the Digital Millennium Copyright Act and subject to legal action. By purchasing this product you acknowledge that you have read and understood these terms of use.

