STATISTICS - Analyzing HISTOGRAMS Task Cards
weatherly
967 Followers
Grade Levels
6th - 9th, Homeschool
Subjects
Resource Type
Formats Included
- PDF
Pages
10+
weatherly
967 Followers
What educators are saying
This was a fun way to engage my students when learning about histograms. The students enjoy getting to move around the room answering questions.
Description
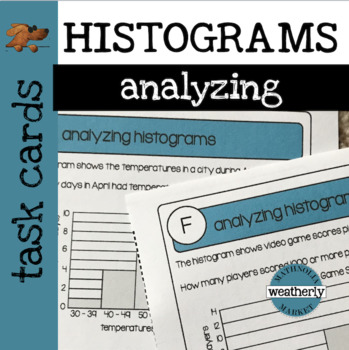
This set of task cards provides practice analyzing histograms after students have been introduced to the concept.
It is important that students understand that histograms are organizational displays that present data in intervals. These histograms are used to identify certain characteristics of the data; such as the median, the number of data points, and a comparison of data in respect to the intervals.
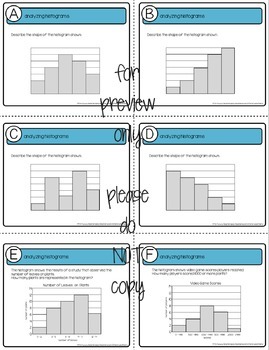
Included are 10 problems on individual cards.
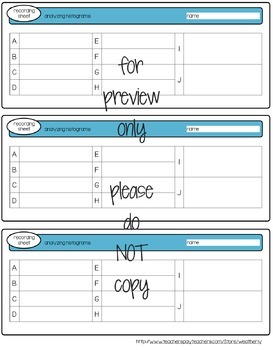
TWO OPTIONS are included for recording answers.
A traditional recording sheet for students to use that allows space for writing a justification.
DIFFERENTIATION recording sheet that provides multiple choices for answers.
Skills include the following:
identify the distribution by examining the shape of the display
find the number of data in the display
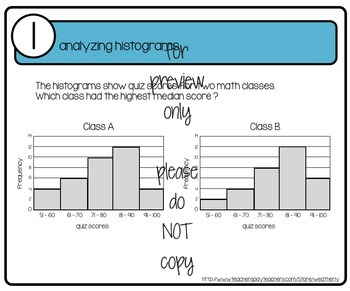
identify the interval within which the median is found
compare two displays
Students are also asked to create three true statements about a histogram.
An answer key is included.
GREAT for math stations, SCOOT, exit passes, flash cards. There are several ways to implement the cards; whole class (projected with document camera) or small group (using collaboration, varying abilities).
I would love to hear how you use the cards in your class... feedback is terrific.
Total Pages
10+
Answer Key
Included
Teaching Duration
N/A
Report this resource to TPT
Reported resources will be reviewed by our team. Report this resource to let us know if this resource violates TPT’s content guidelines.


