SCATTER GRAPHS, LINE GRAPHS AND STEM & LEAF DIAGRAMS
Helen's Essential Maths Store
13 Followers
Grade Levels
8th - 11th
Subjects
Resource Type
Formats Included
- PPT
Pages
23 pages
Helen's Essential Maths Store
13 Followers
Description
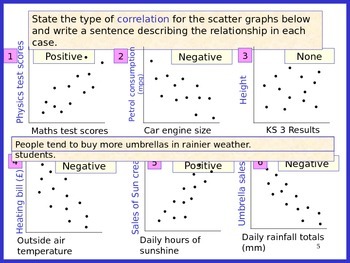
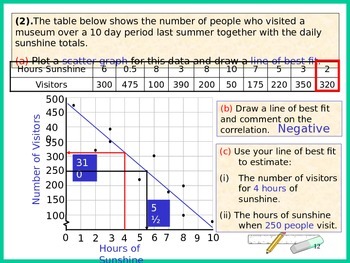
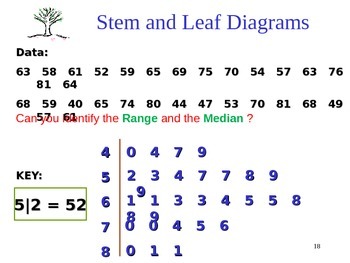
This lesson focuses on interpreting scatter diagrams and appreciating the relationship that a large amount of data can show. It also looks at plotting stem and leaf diagrams and calculating averages from these, as well as plotting and interpreting line graphs. This lesson is designed to be fairly interactive, with questions/ answers included. This also reduces the need for printing. Although originally designed for a GCSE group, this resource will prove useful in any math lesson. Learning aims are also included so students can measure their level of understanding and success in class. A lesson I have enjoyed teaching myself!
Total Pages
23 pages
Answer Key
Included
Teaching Duration
90 minutes
Report this resource to TPT
Reported resources will be reviewed by our team. Report this resource to let us know if this resource violates TPT’s content guidelines.


