
Reading and Interpreting Graphs Color by Number | Math Science Color By Number


What educators are saying
Also included in
 This growing bundle of science color by number activities includes a wide range of topics from life science, earth & space science, physical science, chemistry, and general science.What does a growing bundle mean?Purchasing this growing bundle means that you save over 20% on all current resourcePrice $175.00Original Price $231.77Save $56.77
 This growing bundle of common core math color by number activities includes a wide range of topics from ratios & proportional relationships, the number system, expressions & equations, geometry, statistics & probability, and general math topics.What does a growing bundle mean?PurchasingPrice $113.00Original Price $142.29Save $29.29
 This growing bundle of 8th grade math color by number activities includes a wide range of topics from ratios & proportional relationships, the number system, expressions & equations, geometry, statistics & probability, and general math topics.What does a growing bundle mean?Purchasing thPrice $43.99Original Price $55.80Save $11.81
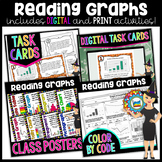 Save over 30% on this bundle of fun activities that will aid students in identifying and interpreting types of graphs including histograms, bar graphs, pie charts, line graphs, pictograms, frequency tables, and tally charts.With what standard do these resources align?This resource will aid studentsPrice $8.99Original Price $13.27Save $4.28
Description
This Reading & Interpreting Graphs Color By Number would work great for science or math! It includes 12 questions in which students will use their knowledge of bar graphs, line graphs, tables, pie graphs, and more to answer the questions. Students will need to understand percents and ratios as well.
With what standard does this resource align?
This resource will aid students in moving towards mastery of CCSS.MATH.PRACTICE.MP4 - Model with mathematics.
What do I have to do?
These color by numbers are no prep! Print the answer sheet on one side and the coloring on the other or print both on one side to save ink and copier counts.
How do I use color by numbers?
• Review
• Early finishers
• Substitute work
• Use the answer sheet as a quiz!
• Brain breaks
• Behavior rewards
What is included?
⭐ 1 Student Answer Sheet with Key (2 Pages)
⭐ 1 Color By Number Sheet with Key
Connect with me
Visit The Morehouse Magic Blog
The Morehouse Magic on Facebook
