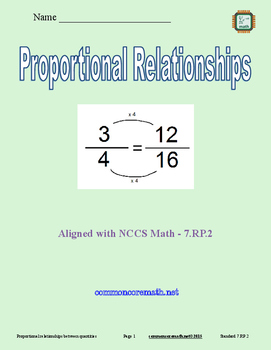
Proportional Relationships - 7.RP.2
Common Sense Math
201 Followers
Resource Type
Standards
CCSS7.RP.A.2
CCSS7.RP.A.2a
CCSS7.RP.A.2b
CCSS7.RP.A.2c
CCSS7.RP.A.2d
Formats Included
- Zip
Pages
6 pages
Common Sense Math
201 Followers
Description
Recognize and represent proportional relationships between quantities. Scaffolded lesson provides for classroom differentiation. Can be used as a lesson leader, guided practice, independent practice, for cooperative learning and math centers, or as an assessment. Use with smartboard, projector, computer, pad or as printable. Lesson is complete - NO PREP. Editable version included.
Objectives:
- Determine whether two quantities are proportional by:
A.) testing for equivalent ratios in a table
B.) Observing whether a graph on the coordinate plane is a straight line through the origin
- Identify the constant of proportionality (unit rate)
- Represent proportional relationships by equations
- Explain a point on the graph in terms of the origin or unit rate
Includes 6 practice pages and answer keys.
Aligned with NCCS Math - 7.RP.2
Visit commoncoremath.net for additional help.
Total Pages
6 pages
Answer Key
Included
Teaching Duration
2 days
Report this resource to TPT
Reported resources will be reviewed by our team. Report this resource to let us know if this resource violates TPT’s content guidelines.
Standards
to see state-specific standards (only available in the US).
CCSS7.RP.A.2
Recognize and represent proportional relationships between quantities.
CCSS7.RP.A.2a
Decide whether two quantities are in a proportional relationship, e.g., by testing for equivalent ratios in a table or graphing on a coordinate plane and observing whether the graph is a straight line through the origin.
CCSS7.RP.A.2b
Identify the constant of proportionality (unit rate) in tables, graphs, equations, diagrams, and verbal descriptions of proportional relationships.
CCSS7.RP.A.2c
Represent proportional relationships by equations. For example, if total cost 𝘵 is proportional to the number 𝘯 of items purchased at a constant price 𝘱, the relationship between the total cost and the number of items can be expressed as 𝘵 = 𝘱𝘯.
CCSS7.RP.A.2d
Explain what a point (𝘹, 𝘺) on the graph of a proportional relationship means in terms of the situation, with special attention to the points (0, 0) and (1, 𝘳) where 𝘳 is the unit rate.


