TPT
Total:
$0.00

Probability Google Form Bundle – Perfect for Google Classroom!

Rated 4.61 out of 5, based on 18 reviews
4.6 (18 ratings)
;
Wrestle with Math
1.4k Followers
Grade Levels
6th - 8th
Subjects
Resource Type
Standards
Formats Included
  • Zip
  • Google Apps™
  • Internet Activities
Pages
36 pages
$16.80
List Price:
$24.00
You Save:
$7.20
Bundle
$16.80
List Price:
$24.00
You Save:
$7.20
Bundle
Share this resource
Report this resource to TPT
Wrestle with Math
1.4k Followers
Includes Google Apps™
This bundle contains one or more resources with Google apps (e.g. docs, slides, etc.).

What educators are saying

I loved the variety of your work, and the mini lessons are perfect reteachings for my special education kids.

Products in this Bundle (9)

    showing 1-5 of 9 products

    Description

    Probability Google Form Bundle – Perfect for Google Classroom!

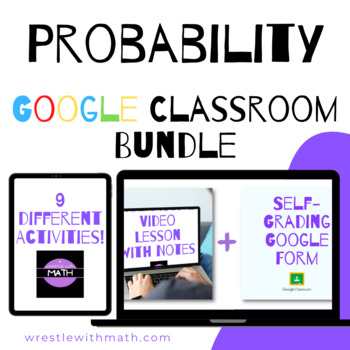
    This Google Form bundle includes 9 individual products about probability. I use these forms as part of my middle school unit of study on probability.  This bundle is perfect for teachers using Google Classroom.

    The following products are included in the bundle:

    Experimental VS Theoretical Probability - Google Form & Video Lesson! - TRY IT FREE!

    Introduction to Probability - Google Form & Video Lesson!

    The Counting Principle - Google Form & Video Lesson!

    Probability of Dependent Events - Google Form & Video Lesson!

    Probability of Independent Events - Google Form & Video Lesson!

    Factorials - Google Form & Video Lesson!

    Combinations - Google Form & Video Lesson!

    Permutations - Google Form & Video Lesson!

    Sampling - Making Predictions Using Data - Google Form & Video Lesson!

    Each product contains the following:

    (1) Google form containing a variety of practice problems. Each form may be used as a practice resource, assessment or collaborative learning tool. 

    (1) Interactive video lesson on each topic

    (1) Notes package that complement the video lesson

    Enjoy!

    "The mission of Wrestle with Math is to create engaging, highly effective resources for the math classroom"

    Total Pages
    36 pages
    Answer Key
    N/A
    Teaching Duration
    N/A
    Report this resource to TPT
    Reported resources will be reviewed by our team. Report this resource to let us know if this resource violates TPT’s content guidelines.

    Standards

    to see state-specific standards (only available in the US).
    Understand that statistics can be used to gain information about a population by examining a sample of the population; generalizations about a population from a sample are valid only if the sample is representative of that population. Understand that random sampling tends to produce representative samples and support valid inferences.
    Use data from a random sample to draw inferences about a population with an unknown characteristic of interest. Generate multiple samples (or simulated samples) of the same size to gauge the variation in estimates or predictions. For example, estimate the mean word length in a book by randomly sampling words from the book; predict the winner of a school election based on randomly sampled survey data. Gauge how far off the estimate or prediction might be.
    Understand that the probability of a chance event is a number between 0 and 1 that expresses the likelihood of the event occurring. Larger numbers indicate greater likelihood. A probability near 0 indicates an unlikely event, a probability around 1/2 indicates an event that is neither unlikely nor likely, and a probability near 1 indicates a likely event.
    Approximate the probability of a chance event by collecting data on the chance process that produces it and observing its long-run relative frequency, and predict the approximate relative frequency given the probability. For example, when rolling a number cube 600 times, predict that a 3 or 6 would be rolled roughly 200 times, but probably not exactly 200 times.
    Develop a probability model and use it to find probabilities of events. Compare probabilities from a model to observed frequencies; if the agreement is not good, explain possible sources of the discrepancy.

    Reviews

    Questions & Answers

    1.4k Followers