Position Time Lesson
Kenneth Dollar
0 Followers
Grade Levels
9th - 12th
Subjects
Formats Included
- Google Slides™
- Internet Activities
Pages
20 pages
Kenneth Dollar
0 Followers

Made for Google Drive™
This resource can be used by students on Google Drive or Google Classroom. To access this resource, you’ll need to allow TPT to add it to your Google Drive. See our FAQ and Privacy Policy for more information.
Description
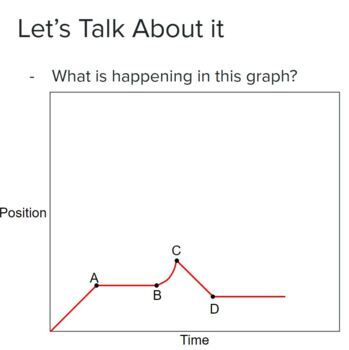
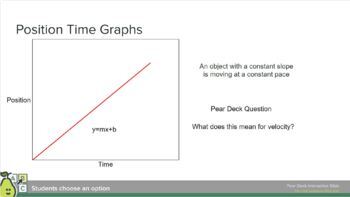
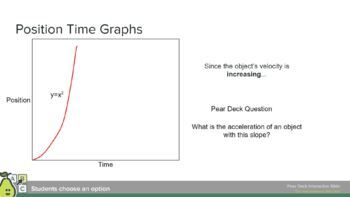
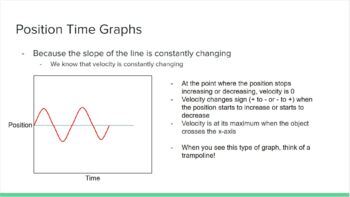
This Google Slide presentation includes Pear Deck slides. Provided are four examples of different position time graphs with detailed explanations of how the PT graph relates to the velocity and acceleration of the object being represented.
We relate PT graphs to the Rate of Change (the derivative) of the line. Rate of change is explained as slope and is touched on again, briefly, in these slides.
I found that this method of teaching Position Time graphs was the most effective method with my Freshman students.
Total Pages
20 pages
Answer Key
Does not apply
Teaching Duration
90 minutes
Report this resource to TPT
Reported resources will be reviewed by our team. Report this resource to let us know if this resource violates TPT’s content guidelines.


