My Math Tutor
33 Followers
Grade Levels
9th - 12th
Subjects
Resource Type
Standards
CCSSHSF-IF.A.1
CCSSHSF-IF.B.4
CCSSHSF-IF.C.8a
CCSSHSF-BF.B.3
Formats Included
- PDF
Pages
1 page
My Math Tutor
33 Followers
Description
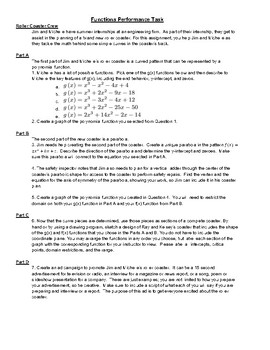
A performance task using polynomial and quadratic functions. In this task, students will use polynomials to design a rollercoaster and identify important information like intercepts, maximum, minimum, and axis of symmetry. If you enjoy this, I would encourage you to check out a few more of my products I have found extremely helpful in my teaching career.
-Number Sense (PowerPoint Presentation)
- Graphing Quadratics Equations
- Solving Quadratics Equations
Total Pages
1 page
Answer Key
Not Included
Teaching Duration
50 minutes
Report this resource to TPT
Reported resources will be reviewed by our team. Report this resource to let us know if this resource violates TPT’s content guidelines.
Standards
to see state-specific standards (only available in the US).
CCSSHSF-IF.A.1
Understand that a function from one set (called the domain) to another set (called the range) assigns to each element of the domain exactly one element of the range. If 𝘧 is a function and 𝘹 is an element of its domain, then 𝘧(𝘹) denotes the output of 𝘧 corresponding to the input 𝘹. The graph of 𝘧 is the graph of the equation 𝘺 = 𝘧(𝘹).
CCSSHSF-IF.B.4
For a function that models a relationship between two quantities, interpret key features of graphs and tables in terms of the quantities, and sketch graphs showing key features given a verbal description of the relationship.
CCSSHSF-IF.C.8a
Use the process of factoring and completing the square in a quadratic function to show zeros, extreme values, and symmetry of the graph, and interpret these in terms of a context.
CCSSHSF-BF.B.3
Identify the effect on the graph of replacing 𝘧(𝘹) by 𝘧(𝘹) + 𝘬, 𝘬 𝘧(𝘹), 𝘧(𝘬𝘹), and 𝘧(𝘹 + 𝘬) for specific values of 𝘬 (both positive and negative); find the value of 𝘬 given the graphs. Experiment with cases and illustrate an explanation of the effects on the graph using technology.


