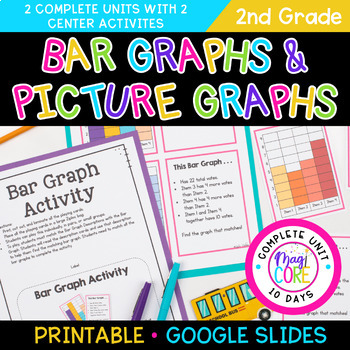
Picture & Bar Graphs Interpreting Data Worksheets Activities 2.MD.D.10 2nd Grade
- Zip
- Google Apps™

What educators are saying
Also included in
- ➕ This year-long 2nd grade math unit curriculum bundle covers all standards. Includes full lessons on place value, odd or even, comparing numbers, counting to 1000, reading and writing numbers to 1000, greater than less than, adding and subtracting with 10's and 100's and up to 1000, place value, moPrice $87.33Original Price $124.75Save $37.42
- This Common Core aligned second grade math curriculum includes mini lesson presentations, student practice, vocabulary, activities, assessments, and task cards for centers. Everything you need for teaching every 2nd grade Common Core standard is in one place! Rest assured, this unit will provide effPrice $244.00Original Price $344.00Save $100.00
Description
⭐️This 2nd grade math unit takes bar graphs and picture graphs to new heights! 2nd grade students will use bar graphs and picture graphs to represent a data set with up to four categories, then solve simple put-together, take-apart, and compare problems using information presented in the graph. With this complete and comprehensive unit, students will master how to interpret data in bar graphs and picture graphs through numerous targeted worksheets, 2 engaging center games, detailed anchor charts, create your own graph activities, and 2 comprehensive unit assessments! This unit provides complete plans for teaching both bar graphs and picture graphs. With 10 days worth of detailed lesson plans, this graphing and data unit also features 2 fun games to play and engaging center activities that can be utilized throughout the year! Everything you need to understand, teach, and engage students is included in this complete unit long set.
⭐️Includes components in both Google Slides and Printable PDF. With this unit, students with develop, practice, reinforce, and review their graphing and data skills.
⭐️This unit is aligned to common core standards 2.MD.D.10 If you do not use Common Core, this packet is still perfect for teaching 2nd grade bar graph, picture graph, and data skills.
What's Included?
- Pedagogy
- 10 Days Worth of Detailed Lesson Plans – Bar Graph and Picture Graph
- Vocabulary
Bar Graphs
- Bar Graph Template
- Bar Graph Anchor Chart
- Day 1 Model Bar Graph
- Favorite School Subject Bar Graph
- Favorite Color Bar Graph
- Dream Vacation Bar Graph
- M&M Color Bar Graph
- Favorite Holiday Bar Graph
- Favorite Ice Cream Flavor Bar Graph
- Fruit Loop Colors Bar Graph
- Biggy Bank Coins Bar Graph
- Bar Graph Activity
- Bar Graph Quiz
Picture Graphs
- Picture Graph Anchor Chart
- Model Day 1 Picture Graph
- Favorite Cake Flavor Picture Graph
- Favorite Fruit Picture Graph
- Favorite Candy Picture Graph
- Favorite Zoo Animal Picture Graph
- Model Day 2 Picture Graph
- Favorite Pet Picture Graph
- Favorite Season Picture Graph
- Model Day 3 Picture Graph
- Favorite Sport Picture Graph
- Favorite Fairy Tale Picture Graph
- Create Your Own Picture Graph
- Picture Graph Quiz
- Picture Graph Scoot
Copyright & Terms of Use
For copyright information and a summary of how this resource can and cannot be used, please review the Terms of Use Page.
Related Product(s):
2nd Grade Measurement Interactive Journal- All Measurement Common Core Standards
2.MD.D.9- Line Plots With Measurement Data (2nd Grade)
Customer Tips:
How to get TPT credit to use on future purchases:
• Please go to your My Purchases page (you may need to login). Beside each purchase, you'll see a Provide Feedback button. Simply click it and you will be taken to a page where you can give a quick rating and leave a short comment for the product. Each time you give feedback, TPT gives you feedback credits that you use to lower the cost of your future purchases. I value your feedback greatly as it helps me determine which products are most valuable for your classroom so I can create more for you. ☺
Be the first to know about my new discounts, freebies, and product launches:
• Look for the green star next to my store logo and click it to become a follower. Voila! You will now receive email updates about this store. ☺
• Follow me on Facebook for updates on new products and sales
• Follow me on Instagram
*****************************************************************************


