
Percent of Change Task Cards Activity - print and digital


- PDF
- Google Apps™

What educators are saying
Also included in
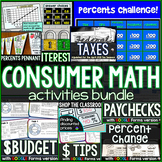 Financial literacy is so fun to teach, and it's so important for high school students to learn how to manage their personal finances. Learning consumer math empowers students as they navigate bills, budgets, taxes and interest rates, especially as they inch closer towards graduation.This bundle inclPrice $34.00Original Price $73.00Save $39.00
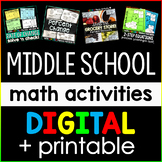 This bundle contains print and digital middle school math activities. Each activity inside comes in both forms. The digital versions are linked within the printable files and were built in either Google Slides or Google Forms, depending on which made sense for the activity. The Google Forms can be dPrice $44.00Original Price $66.50Save $22.50
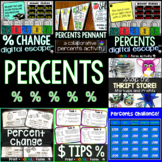 Included in this bundle of percent activities are two digital math escape rooms for finding percent increase and decrease and for reviewing percents, two digital Google Forms activities for finding percent markup/profit and discounts, a percent discounts math pennant, print and digital task cards foPrice $16.50Original Price $25.00Save $8.50
Description
Students calculate and compare percent change between present and past costs of items in this financial literacy activity. Students then determine which item's cost increased the most over the years. Students compare prices of food, cars, homes, salaries and other items from what they cost in past decades to what they cost today. Prices are historically accurate, which brings up good discussion about inflation and the cost of living.
With new digital GOOGLE Forms version included, students can work on their tasks online. Each digital task has spaces to type the percent changes seen in the table and also a multiple choice to clock for which percent change is greater. The printable version is still included in the download.
There are 16 task cards. Printable student answer sheet and answer key included. Includes both print + interactive digital versions.
You may also like:
