Parabolas & Circles-Functions & Graphs Review- Math Test Prep
CAS Take on Maths
248 Followers
Grade Levels
10th - 12th, Homeschool
Subjects
Resource Type
Standards
CCSS8.F.A.1
CCSSHSF-IF.A.1
CCSSHSF-IF.B.4
CCSSHSF-IF.C.8a
CCSSHSF-IF.C.9
Formats Included
- Zip
Pages
44 pages (Worksheets + Step by Step Solutions + Teacher Notes)
CAS Take on Maths
248 Followers
Description
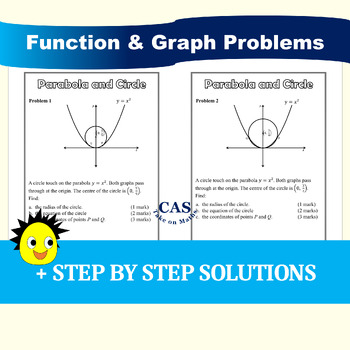
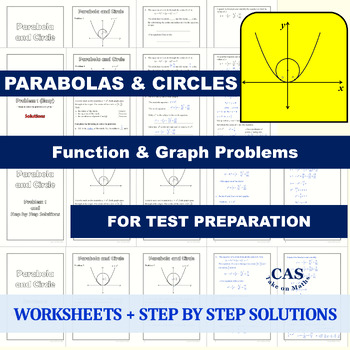
PARABOLA & CIRCLE PROBLEMS - FUNCTIONS & GRAPHS REVIEW for Math Test Preparation.
Working mathematically & critical thinking to solve problems involving function and relation graphs.
The resource contents: Worksheets + Step by step solutions + Teacher notes.
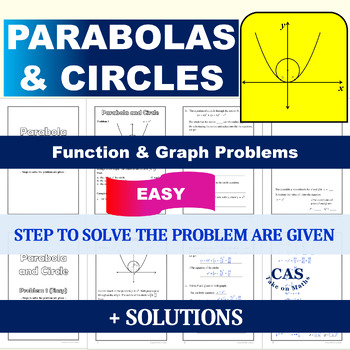
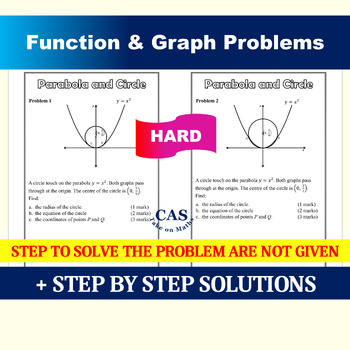
Problem 1 in 2 skills:
- Easy: Steps to solve the problem are given.
- Hard: Steps to solve the problem are not given.
Problem 2: Steps to solve the problem are not given.
Grades: 10th & 12th
Learning Outcomes:
- Recognise features of the graphs of x^2 + y^2 = r^2 and (x − h)^2 + (y − k)^2 = r^2, including their circular shapes, their centres and their radii.
- Recognise features of the graph of y = x^2 including its parabolic shape and its axis of symmetry.
- Find the intersection points of a parabola and a circle.
Also comply with Australian Curriculum:
- Understand the concept of the graph of a function (ACMMM024)
- Recognise features of the graphs of x^2 + y^2 = r^2 and (x − h)^2 + (y − k)^2 = r^2, including their circular shapes, their centres and their radii. (ACMMM020)
- Recognise features of the graph of y = x^2 including its parabolic shape and its axis of symmetry. (ACMMM021)
- MA-F1: Working with functions.
Other products about functions:
- Mapping Diagrams and Functions Workbook
- Classifying and Mapping Relations Workbook
- Asymptotes of Rational Functions Video lesson
- Asymptotes of Rational Functions Worksheets
My other resources:
Total Pages
44 pages (Worksheets + Step by Step Solutions + Teacher Notes)
Answer Key
Included
Teaching Duration
N/A
Report this resource to TPT
Reported resources will be reviewed by our team. Report this resource to let us know if this resource violates TPT’s content guidelines.
Standards
to see state-specific standards (only available in the US).
CCSS8.F.A.1
Understand that a function is a rule that assigns to each input exactly one output. The graph of a function is the set of ordered pairs consisting of an input and the corresponding output.
CCSSHSF-IF.A.1
Understand that a function from one set (called the domain) to another set (called the range) assigns to each element of the domain exactly one element of the range. If 𝘧 is a function and 𝘹 is an element of its domain, then 𝘧(𝘹) denotes the output of 𝘧 corresponding to the input 𝘹. The graph of 𝘧 is the graph of the equation 𝘺 = 𝘧(𝘹).
CCSSHSF-IF.B.4
For a function that models a relationship between two quantities, interpret key features of graphs and tables in terms of the quantities, and sketch graphs showing key features given a verbal description of the relationship.
CCSSHSF-IF.C.8a
Use the process of factoring and completing the square in a quadratic function to show zeros, extreme values, and symmetry of the graph, and interpret these in terms of a context.
CCSSHSF-IF.C.9
Compare properties of two functions each represented in a different way (algebraically, graphically, numerically in tables, or by verbal descriptions). For example, given a graph of one quadratic function and an algebraic expression for another, say which has the larger maximum.


