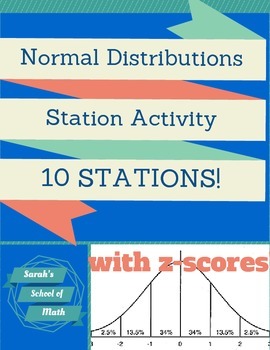
Normal Distributions Station Activity: 10 stations! (with z-scores)
- Zip
What educators are saying
Description
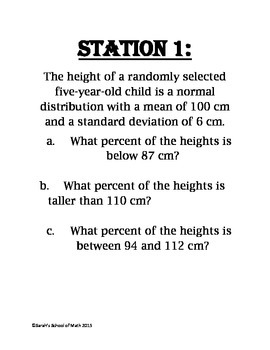
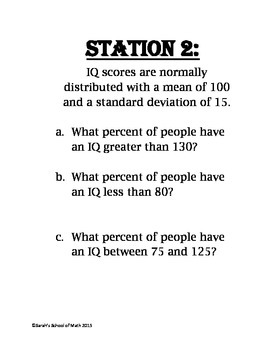
This activity consists of 10 stations. Each station gives a data set (in words) that is normally distributed and gives the mean and standard deviation of that data set. Students are then asked at least 3 questions about that data set that involve finding the z-score and using a z-score table. Includes a student answer sheet and answer key. I have two other normal distribution station activities that do not involve z-scores. See the links below.
Looking for other resources on statistics/probability? Check out:
Normal Distributions Station Activity (No z-scores req) (% used: 34, 13.5, 2.5)
Normal Distribution Station Activity (no z-scores) (% used: 34, 13.5, 2.35,0.15)
Conditional Probability Around the World Activity (scavenger hunt)
Basic Probability Class Survey
Probability using the Binomial Distribution Around the World Activity
Basic Probability Matho Game-Includes the addition rule!
Margin of Error, Sample Size, Population Intervals DOMINO Activity


