Normal Distribution Empirical Rule
Math by K8
46 Followers
Grade Levels
9th - 12th
Subjects
Resource Type
Standards
CCSSHSS-ID.A.4
Formats Included
- PDF
Math by K8
46 Followers
Also included in
- Highly engaging activities! The students will start by understanding how to label a normal curve with mean and standard deviation, shade desired areas and use the empirical rule to estimate the area. Then, once the standardize score is learned, students can practice finding exact area.Price $6.00Original Price $9.00Save $3.00
Description
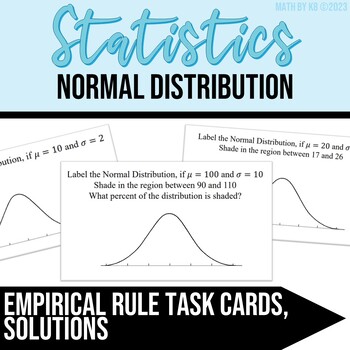
Normal Distribution Using Empirical Rule, labeling mean and standard deviation and shading desired area!
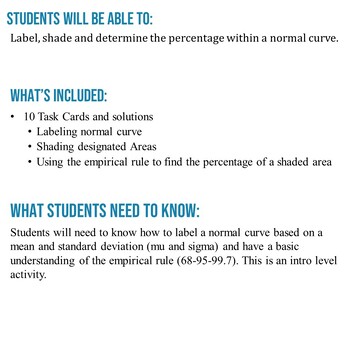
Concepts needed for this activity:
- Basic understanding of Normal Distribution
- 1, 2, and 3 standard deviations above and below
- Empirical rule (68, 95, 99.7) OR knowledge of z-score to find percentages
They start out basic, having the students label the mean and standard deviations on a Normal curve, then have the students shade a desired area and end with the students calculating a probability of an area. Students can do all of these by just knowing the Empirical Rule, for a more challenging activity, see other activities!
- Normal Distribution Matching - More challenging, needs knowledge of z-score
Total Pages
Answer Key
Included
Teaching Duration
30 minutes
Report this resource to TPT
Reported resources will be reviewed by our team. Report this resource to let us know if this resource violates TPT’s content guidelines.
Standards
to see state-specific standards (only available in the US).
CCSSHSS-ID.A.4
Use the mean and standard deviation of a data set to fit it to a normal distribution and to estimate population percentages. Recognize that there are data sets for which such a procedure is not appropriate. Use calculators, spreadsheets, and tables to estimate areas under the normal curve.


