⭐NO PREP Statistics & Probability Escape Room {7th Grade Math}⭐
- PDF
Also included in
- Looking for no-prep, fun, and engaging activities for middle school students? Look no further! This bundle is a great way to review all the 7th Grade Math Common Core Standards with your students in a fun and engaging way. Your students will be asking for more math! These escape rooms will have yourPrice $24.99Original Price $29.94Save $4.95
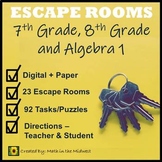
- Looking for a great way to get students engaged and excited about practicing the 7th and 8th grade math standards? LOOK NO MORE! This bundle will engage your students and they will even enjoy doing math! Plus there is NO PREP all you need is an internet browser as well as either a laptop, ChromebookPrice $49.99Original Price $83.88Save $33.89
- Looking for a way to get students engaged and excited about practicing math in the middle school? LOOK NO MORE! This bundle will engage your students and they will even enjoy doing math! Plus there is NO PREP all you need is an internet browser as well as either a laptop, Chromebook, iPad, tablet, oPrice $69.99Original Price $125.88Save $55.89
- This bundle is the best way to save you money on all things 7th Grade Math. PDF and Google Resources are included in this bundle. Click on the preview to easily access everything that is included.⭐7th Grade Math Exam Bundle⭐This product contains 2 questions per standard over ALL THE 7th Grade Math SPrice $187.49Original Price $374.40Save $186.91
- All the 7th Grade Math Escape Rooms you could ever want in one bundle! This bundle contains 30 unique escape rooms that cover all of the 7th Grade Math Common Core Standards. This is a great way to get students working together in a fun and engaging way to review 7th Grade Math skills. Plus there isPrice $74.99Original Price $154.69Save $79.70
Description
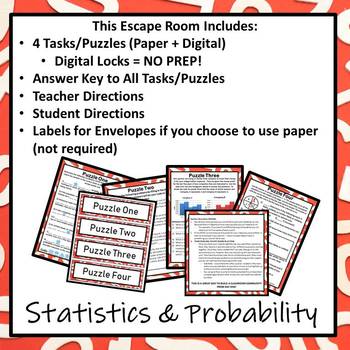
PDF AND GOOGLE FORM CODE INCLUDED. It is a great way for students to work together and review their knowledge of statistics & probability. There are a total of 4 tasks/puzzles included as well as a Google Form Code if you want to do the whole thing digitally with no paper. If you would rather use paper all you have to do is print and you are ready to go, no prep needed! All of the tasks/puzzles are included in a PDF for quick printing.
Topics Covered:
- Statistics & Probability Vocabulary
- Using data from random samples to draw inferences about a population
- Looking at two numerical data distributions (on a histogram) with similar variabilities
- Probability of Chance Events
- Probability of Compound Events
What's Included?
- 4 Tasks/Puzzles to help with Team Building
- PDF (Paper Copies)
- Google Form Code (Digital)
- Answer Key for all tasks/puzzles
- Teacher Directions
- Student Directions
- Labels for envelopes (if you want, not required)
How to play:
- Divide your class into groups (2 - 5 students per group)
- Each group will need a computer, tablet, or paper copies (if you don't want to use the digital locks)
- Most students will complete this escape room in 45 minutes.
⭐Escape Room Bundles:
- Team Building Activities/Escape Room
- Middle School Math Escape Room Bundle
- Algebra 1 Escape Room Bundle
- 8th Grade Math Escape Room Bundle
- 7th Grade Math Escape Room Bundle
⭐GOOGLE RESOURCES:
- 7th Grade Math Google Classroom Bundle
- 7th Grade Math Interactive Notebook Bundle
- 8th Grade Math Google Classroom Bundle
- 8th Grade Math Interactive Notebook Bundle
⭐PRINTABLE (PAPER) RESOURCES:
⭐ULTIMATE BUNDLES:

