Miller PreCalc Canva Slides 1.1: The Rectangular Coordinate Plane
- PDF
Description
Description:
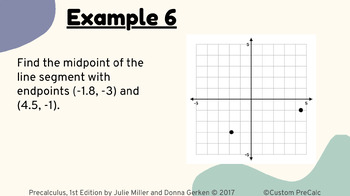
These are Canva presentation slides of section 1.1 of the textbook Precalculus, 1st edition by Julie Miller and Donna Gerken. It is a redesign of the publisher's PowerPoint.All examples included are the work of the publisher and are not my own.This is a digital resource. The presentation is VIEW ONLY so cannot be edited. Scroll to the last page to access the presentation link and solutions link.
Terms of Use:
- All items in this product are copyrighted.
- You are not allowed to sell any item in this product.
- This resource is for one person to use only. For use in multiple classrooms, please purchase additional licenses.
- This resource may not be uploaded to the internet in any form, including classroom/personal websites or network drives, unless the site is password protected and can only be accessed by students.
Acknowledgements:
This resource is an adaption of a PowerPoint from the publishers of the textbook Precalculus, 1st edition by Julie Miller and Donna Gerken. Examples provided are theirs and not my own.
Graphics and slide layout created using Canva Pro. Their website is www.canva.com.
Coordinate planes created using GraphFree online. Their website is https://www.graphfree.com/.
Graphs created using Desmos (https://www.desmos.com/) and the teacher paid version of TI-84 CE graphing calculator emulator.
Some of the text and formulas created using the equation editor in Google Docs.
Miller PreCalc 1.1: The Rectangular Coordinate Plane Canva Presentation
Thank you for your purchase!
Angela Xander


