
Measures of Central Tendency + Box Plots Digital Zombie Game for Google Slides


- PDF
- Google Apps™
- Internet Activities

Also included in
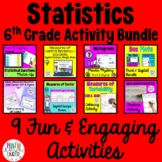 Grab a bargain with this bundle of 10 fun and engaging activities for your Statistics Unit. Standards and topics covered include:-Statistical Questions-Histograms-Measures of Central Tendency - Mean, Median, Mode, Range-Box Plots-Dot Plots-Measures of Variability - Interquartile Range & Mean AbsPrice $20.00Original Price $31.25Save $11.25
Description
Your students will love this digital game using Google Slides that practices mean, median, mode, range, reading box plots, IQR, and more. The game is a fun adventure which has you in the middle of a Zombie Apocalypse! Students will solve various questions that involve data analysis (15 in total) to survive.
For this resource, each student who will be completing the activity needs a Google account (although no sign in is required!) and Internet access. You will receive a link to the game to share with your class. Teacher directions are included to help you in implementing this digital resource in your classroom.
Also included in your download is optional student worksheets with all of the problems to show working out and demonstrate engagement.
The topics covered in the questions include:
* Average of two numbers
* Mean
* Median
* Mode
* Range
* Identifying Quartiles
* Calculating Quartiles
* Calculating the Interquartile Range
* Reading Box and Whisker Plots
* Finding the Minimum and Maximum values
Have a look at the preview file to get a better idea of what this resource looks like. Please follow my store and thank you for your support!
Great for:
- Review
- Math Centers
- Choice Boards
- Homework
- Distance Learning
- Cover Lesson
