TPT
Total:
$0.00

Measurement and Data 3rd Grade BOOM Cards Bundle | time | graphs | measurement

Rated 5 out of 5, based on 2 reviews
5.0 (2 ratings)
;
The Rocket Resource
2.6k Followers
Grade Levels
3rd
Subjects
Resource Type
Standards
Formats Included
  • Zip
  • Internet Activities
$16.80
List Price:
$21.00
You Save:
$4.20
Bundle
$16.80
List Price:
$21.00
You Save:
$4.20
Bundle
Share this resource
Report this resource to TPT
The Rocket Resource
2.6k Followers
Compatible with Digital Devices
The Teacher-Author has indicated that this resource can be used for device-based learning.

What educators are saying

My students love Boom Cards! Students who were struggling with measurement and data found this very helpful and enjoyable!

Products in this Bundle (7)

    showing 1-5 of 7 products

    Bonus

    One Click Link to all BOOM decks in Bundle
    Also included in
    1. Need an easy, no-prep way to practice third grade math standards? Get a BOOM deck to cover every third grade math standard with this comprehensive, money-saving bundle! This bundle includes 26 BOOM decks to cover every 3rd grade Common Core math standards. Decks contain between 25-40 cards and a v
      Price $62.00Original Price $77.50Save $15.50

    Description

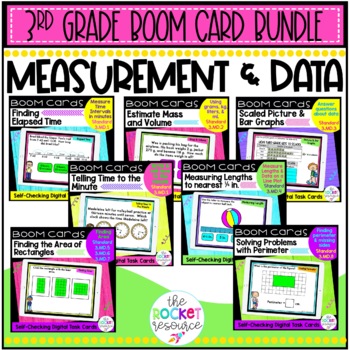
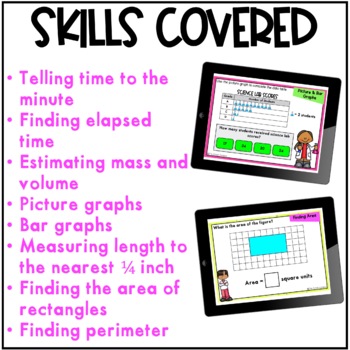
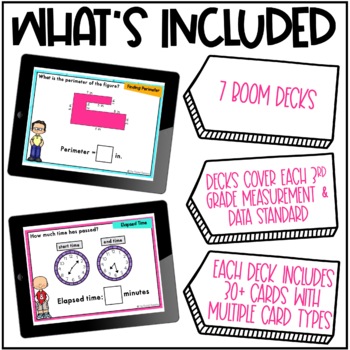
    Your students will love practicing measurement and data with these fun decks! This third grade measurement and data bundle covers telling time to the nearest minute, finding elapsed time, estimating mass and volume, using scaled picture graphs and bar graphs, measuring length to the nearest half and fourth inch, finding the area of rectangles, and finding perimeter. Decks cover each of the 3rd grade measurement and data standards 3.MD.1, 3.MD.2, 3.MD.3, 3.MD.4, 3.MD.5, 3.MD.6, 3.MD.7, 3.MD.8. Each deck contains 30+ cards and a variety of card types. Purchase the bundle to save 20%!

    BUNDLE INCLUDES THE FOLLOWING BOOM DECKS:

    • Time to the Nearest Minute (3.MD.1)
    • Elapsed Time (3.MD.1)
    • Estimating Mass and Volume (3.MD.2)
    • Picture Graphs and Bar Graphs (3.MD.3)
    • Measuring to the Nearest half and fourth inch (3.MD.4)
    • Finding area of rectangles (3.MD.5, 3.MD.6, 3.MD.7)
    • Finding perimeter of polygons (3.MD.8)

    WHAT YOU NEED:

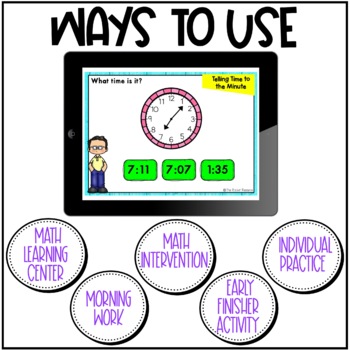
    Boom cards must be used with the Internet. They can be played on recent browsers (Chrome, Safari, Firefox, etc.) or with the app (available for iPad, Android, iPhone, Kindle Fire). You can assign Boom cards for free using the "Fast Pins" option. For more options, you can sign up for a premium Boom Learning account.

    ✸✸✸Once purchased, GET YOUR ONE-CLICK BUNDLE LINK IN THE INCLUDED BONUS FILE.✸✸✸

    Don't forget that leaving feedback earns you points towards FREE TPT purchases. I love feedback.

    Click here to follow me and be notified when new products are uploaded. ★Products are 50% off during the first 48 hours!!

    OTHER PRODUCTS YOU MAY BE INTERESTED IN:

    Other BOOM Cards

    Digital Resources

    Find me online at The Rocket Resource for questions, tips, and more!

    Total Pages
    Answer Key
    Included
    Teaching Duration
    N/A
    Report this resource to TPT
    Reported resources will be reviewed by our team. Report this resource to let us know if this resource violates TPT’s content guidelines.

    Standards

    to see state-specific standards (only available in the US).
    Tell and write time to the nearest minute and measure time intervals in minutes. Solve word problems involving addition and subtraction of time intervals in minutes, e.g., by representing the problem on a number line diagram.
    Measure and estimate liquid volumes and masses of objects using standard units of grams (g), kilograms (kg), and liters (l). Add, subtract, multiply, or divide to solve one-step word problems involving masses or volumes that are given in the same units, e.g., by using drawings (such as a beaker with a measurement scale) to represent the problem.
    Draw a scaled picture graph and a scaled bar graph to represent a data set with several categories. Solve one- and two-step “how many more” and “how many less” problems using information presented in scaled bar graphs. For example, draw a bar graph in which each square in the bar graph might represent 5 pets.
    Generate measurement data by measuring lengths using rulers marked with halves and fourths of an inch. Show the data by making a line plot, where the horizontal scale is marked off in appropriate units-whole numbers, halves, or quarters.
    Recognize area as an attribute of plane figures and understand concepts of area measurement.

    Reviews

    Questions & Answers

    2.6k Followers