Measurement & Graphing Math Project-Based Learning: Paper Airplane Fun
Wild Child Designs
1.1k Followers
Grade Levels
4th - 5th
Subjects
Resource Type
Formats Included
- Zip
- Internet Activities
Pages
33 pages
Wild Child Designs
1.1k Followers
Compatible with Digital Devices
The Teacher-Author has indicated that this resource can be used for device-based learning.
What educators are saying
This was great to involve the students in a graphing and measurement activity with something they already loved doing -- making paper airplanes. The students were able to modify their airplane after seeing results from their trials and we charted the information as a class.
Nothing captures students' attention more than learning how to make an awesome paper airplane. They loved actually measuring the distance flown using tape measures, and yard sticks.
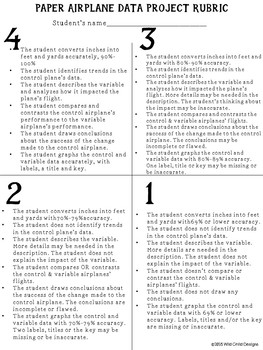
Description
Is it possible for a measurement and graphing project and assessment to be “Print and Go?” It is with this one! This product, by Wild Child Designs, is a two week math investigation, complete with assessment. It is student-tested and ADORED and provides practical application of customary measurement and conversion concepts, as well as graphing concepts (bar graphs, line graphs, line plots, range, median, mode, and mean). It's perfect for fourth or fifth graders.
The steps of this project include:
1. Students research different types of paper airplanes using a provided website.
2. Students explore different types of paper airplanes, creating at least one for test flights.
3. Students work in groups to test their airplanes, measuring distances flown using inches.
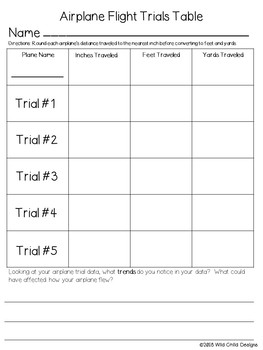
4. They record their data using data tables.
5. Students convert distances in inches to feet and yards.
6. Students create three separate bar graphs (inches, feet, yards), using their collected data.
7. Student groups conduct flight trials using their “best flyers.”
8. Students record their trials data (in yards) on data tables.
9. They create a line graph of their trial data.
10. Students compare line graphs and bar graphs.
11. Student groups compare trial data with that of another group.
12.They create a line graph that shows both sets of group trial data.
13. Students analyze the classes trial data by determining range, median, mode and mean.
14. Students create a line plot representing the whole class data.
INDEPENDENT ASSESSMENT TASKS:
15. Students fold a "control airplane" using basic airplane folding instructions.
16. They conduct trial flights.
17. Students add one variable to their control airplane, and conduct trial flights.
18. Students compare and contrast the control and variable flights, create a line graph, and write about their analysis and conclusions.
19. Students are assessed using a rubric.
This product includes the following materials:
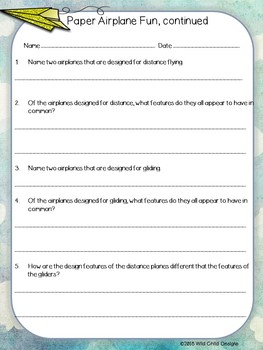
1. 7 pages of detailed teacher directions and tips, one page for each session.
2. Two student research pages, represented in color and black and white for your copying needs.
3. A “Customary Measurement Conversion Sheet, “ represented in color and black and white for your copying needs.
4. An airplane white data table (black and white)
5. An airplane flight trials data table (black and white)
6. 3 Bar graph pages, for data in inches, feet, and yards (black and white)
7. An example bar graph (color)
8. A trials line graph page (black and white)
9. 2 trials line graph examples (color)
10. A “Thinking About Our Graphs” page to compare and contrast line and bar graphs (black and white)
11. A “Thinking About Our Graphs” example answer key
12. An “Analyzing Our Trial Data” page to determine range, median, mean, and mode and for line plot creation (black and white)
13. An “Analyzing Our Trial Data” example
14. A black and white direction sheet for folding a basic control airplane.
15. A data sheet (black and white) for testing the control airplane.
16. A data sheet (black and white) for testing the variable airplane.
17. An "Analyzing Data" sheet (black and white).
18. A black and white trial line graph sheet for control and variable airplane data.
19. A trial line graph example sheet for control and variable airplane data.
Total Pages
33 pages
Answer Key
Included
Teaching Duration
1 Week
Report this resource to TPT
Reported resources will be reviewed by our team. Report this resource to let us know if this resource violates TPT’s content guidelines.


