MATH LESSON & MATH LAB - Ally's Allowance
Jean's MATH
3 Followers
Grade Levels
5th - 9th, Homeschool
Subjects
Resource Type
Standards
CCSS8.SP.A.4
CCSS8.EE.A.1
CCSS8.EE.A.3
CCSS8.F.A.1
CCSSMP1
Formats Included
- PDF
- Excel Spreadsheets
Pages
14 pages
Jean's MATH
3 Followers
Description
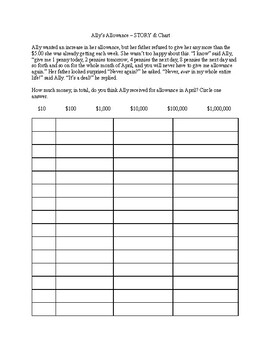
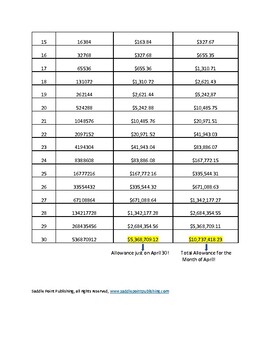
Have students discover exponential growth in this very fun lesson about Ally's allowance! Ally asks her father for a special allowance: 1 penny on April 1st, then 2 pennies, 4 pennies, 8 pennies and so forth and so on for all the consecutive days during the month of April.
This is a tried and true math lesson and lab that I have created and used for many years with my 7th and 8th grade classes. Students get a "kick" out of learning about the power of exponential growth and wish that they too, had an allowance like Ally's!
In the MATH LESSON, students will ...
- read a very short scenario in which Ally asks her father for a higher allowance
- discuss mathematical patterns and predict outcomes
- share ideas of how to chart and consolidate data
- think algebraically and set up expressions and equations in one variable
- recognize the mathematics behind exponential growth with powers of 2 and 3
- find solutions to doubling and tripling an initial amount
- calculate with paper, pencil, and calculator
- develop an appreciation and understanding of bases, exponents, and exponential growth
In the MATH LAB, students will...
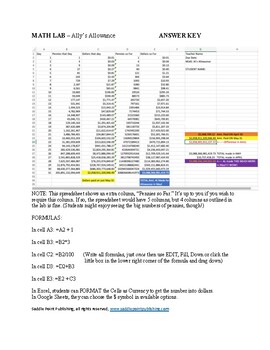
- design a spreadsheet and write formulas to output a quantity that triples each day for a month
- learn function words and their uses in Excel, Google Sheets, or other spreadsheet software
Total Pages
14 pages
Answer Key
Included
Teaching Duration
N/A
Report this resource to TPT
Reported resources will be reviewed by our team. Report this resource to let us know if this resource violates TPT’s content guidelines.
Standards
to see state-specific standards (only available in the US).
CCSS8.SP.A.4
Understand that patterns of association can also be seen in bivariate categorical data by displaying frequencies and relative frequencies in a two-way table. Construct and interpret a two-way table summarizing data on two categorical variables collected from the same subjects. Use relative frequencies calculated for rows or columns to describe possible association between the two variables. For example, collect data from students in your class on whether or not they have a curfew on school nights and whether or not they have assigned chores at home. Is there evidence that those who have a curfew also tend to have chores?
CCSS8.EE.A.1
Know and apply the properties of integer exponents to generate equivalent numerical expressions. For example, 3² × (3⁻⁵) = (3⁻³) = 1/3³ = 1/27.
CCSS8.EE.A.3
Use numbers expressed in the form of a single digit times an integer power of 10 to estimate very large or very small quantities, and to express how many times as much one is than the other. For example, estimate the population of the United States as 3 × 10⁸ and the population of the world as 7 × 10⁹, and determine that the world population is more than 20 times larger.
CCSS8.F.A.1
Understand that a function is a rule that assigns to each input exactly one output. The graph of a function is the set of ordered pairs consisting of an input and the corresponding output.
CCSSMP1
Make sense of problems and persevere in solving them. Mathematically proficient students start by explaining to themselves the meaning of a problem and looking for entry points to its solution. They analyze givens, constraints, relationships, and goals. They make conjectures about the form and meaning of the solution and plan a solution pathway rather than simply jumping into a solution attempt. They consider analogous problems, and try special cases and simpler forms of the original problem in order to gain insight into its solution. They monitor and evaluate their progress and change course if necessary. Older students might, depending on the context of the problem, transform algebraic expressions or change the viewing window on their graphing calculator to get the information they need. Mathematically proficient students can explain correspondences between equations, verbal descriptions, tables, and graphs or draw diagrams of important features and relationships, graph data, and search for regularity or trends. Younger students might rely on using concrete objects or pictures to help conceptualize and solve a problem. Mathematically proficient students check their answers to problems using a different method, and they continually ask themselves, "Does this make sense?" They can understand the approaches of others to solving complex problems and identify correspondences between different approaches.


