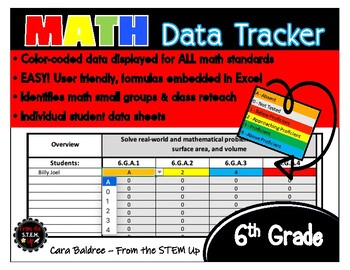
MATH DATA TRACKER: 6th Grade
- Zip
Description
GAME CHANGER ALERT! This 6th grade Math Data Tracker product organizes your students math data with EVERY 6th Grade MATH STANDARD for the school year in a color-coded, EASY to use system. If updated regularly (which takes 2 minutes), this product can help teachers form small groups, know what objectives to reteach, provides the class average per objective, is a fantastic resource for parent-teacher conferences, and helps assess what areas to hit the hardest on end of unit/year testing. Use these in your school PLCs to analyze data, and it’s EASY with directions and a video included. This REALLY focuses your teaching and helps you narrow down exactly what areas in each standards your students misunderstand. Besides collecting the data, the only things teachers need to do include 1) typing your classroom roster ONCE on the first page and it will hyperlink to all other pages (or copy/paste from another document) 2) select the dropdown which displays the color-coding system - or click enter to move down to the next name 3) print out the individual student page for parents with a compilation of ALL data inserted for the year 4) accept compliments from your impressed administrators for tracking student data.
No fear with computer programs! All teachers can use this because formulas are automated. Grades K - 6 are all separately available in math. This completely aligns with the Common Core math standards and proficiency based grading (although it can be adapted to other grading systems.) There are spaces for 35 student names. All pages nicely print out nicely. This was created in Excel but Google Classroom uploads well with very few formatting changes.
Watch the video preview for details on how to use the product. An in-depth video is attached to the purchase.
This purchase is for ONE classroom. Thanks for respecting copyright laws and hours of my hard work.
Also check out:
MATH DATA TRACKER: Kindergarten
8 Mathematical Posters & Matching Student Bookmarks
Multiplication and Division Mixed Fraction Word Problem Task Cards
Distributive Property Common Factor with Fruit Loops
Utah 6th Grade SEED Science Task Cards
Counting Coins Mats (with Advanced Amounts)
Less Than, More Than Math Intervention Cards
NGSS 3 Dimensions of Science Posters: Crosscutting, Core Ideas, Science/Engineer
This product is only to be used by the original purchaser and is for ONE license in ONE classroom. Your first purchase of this product is at the regular listing price. Additional licenses are provided at a discount. Distribution of this product to fellow teachers, classrooms, schools, or districts is strictly PROHIBITED. This product may not be digitally posted for public viewing. All rights reserved by the author. Copyright laws prohibit posting any portion of this product online. © Cara Baldree - From the STEM UP
♥ ♥ ♥ ♥ ♥ ♥ ♥ ♥ ♥ ♥ ♥ ♥ ♥ ♥ ♥ ♥ ♥ ♥ ♥ ♥ ♥ ♥ ♥ ♥ ♥ ♥ ♥ ♥ ♥ ♥ ♥ ♥ ♥ ♥ ♥ ♥ ♥ ♥ ♥ ♥ ♥ ♥
Don't forget that leaving feedback on your purchased items earns you points for FREE TPT items. I love your feedback, and I read every word AND respond.
Follow my store to be notified when new products are posted and when there is a sale. All new products are listed up to 50% off for the first 24 hours!
*********************************************************************
Please contact me at fromthestemup@yahoo.com with any questions you may have or for personalized bundle requests.
Thanks! Cara Baldree


