Linear Relationships Real World Applications Practice Worksheets
- Zip
What educators are saying
Description
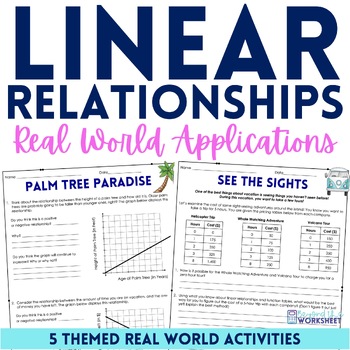
⭐️ This 8th Grade Linear Relationships Practice resource is a targeted educational tool designed for 8th-grade students to master linear relationships through interactive and applied learning.
⭐️ This resource focuses on:
- Understanding Functions
- Analyzing Functional Relationships
- Modeling Relationships with Functions.
⭐️ Students will engage in activities such as identifying linear functions, analyzing tables for rate of change, calculating unit rates, writing equations, and interpreting graphs.
✅ Activity Descriptions
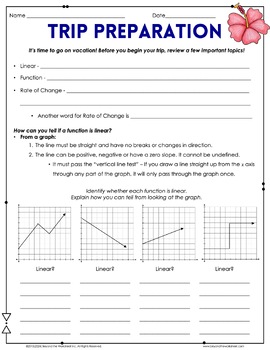
- Trip Preparation – Students identify whether relationships are functions and if they are functions, whether they are linear, using graphs, tables and equations.
- See the Sights – Students analyze rate of change displayed in tables.
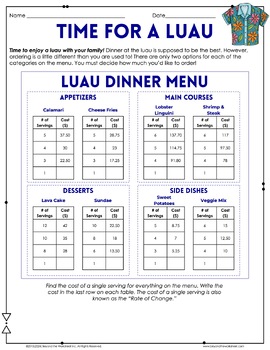
- Time for a Luau – Students use menus and tables to determine unit rate and totals.
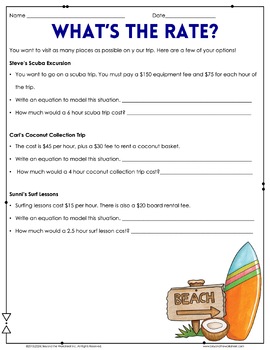
- What’s the Rate? – Students write equations and identify unit rate from graphs.
- Palm Tree Paradise – Students identify whether relationships are positive or negative and explain the meaning in the context of given situations. They also must sketch graphs given certain conditions.
❤️ Perfect for classroom use, homework assignments, or extra practice, this resource provides a solid foundation in linear relationships, preparing students for Algebra 1.
✅ Available in the following bundle:
Licensing Terms :
By purchasing this product, you own a license for one teacher only for personal use in their own classroom. Licenses are non-transferable and therefore can not be passed from one teacher to another. If the teacher who purchased this license leaves the classroom or changes schools, the license and materials leave with that teacher. No part of this resource is to be shared with colleagues or used by an entire team, grade level, school or district without purchasing the correct number of licenses. If you are a coach, principal or district interested in transferable licenses that would accommodate yearly staff changes, please contact me for a transferable license quote at lindsay@beyondtheworksheet.com.
Copyright Information :
© Beyond the Worksheet. Please note - all material included in this resource belongs to Beyond the Worksheet Inc. By purchasing, you have a license to use the material but you do not own the material. You may not upload any portion of this resource to the internet in any format, including school/personal websites or network drives unless the site is password protected and can only be accessed by students, not other teachers or anyone else on the internet.
✮✮If you are interested in gaining access to an exclusive set of free resources, CLICK HERE.


