TPT
Total:
$0.00

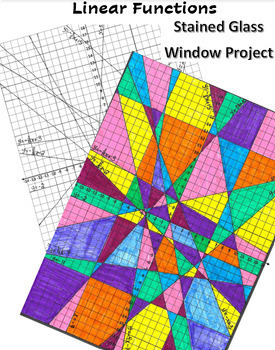
Linear Functions Stained Glass Project

Rated 5 out of 5, based on 1 reviews
5.0 (1 rating)
;
Kara Chipley
3 Followers
Grade Levels
8th - 12th
Subjects
Standards
Formats Included
  • Zip
$5.50
$5.50
Share this resource
Report this resource to TPT
Kara Chipley
3 Followers

Description

My students love doing this project! I have a large portion of EL students in my Pre-Algebra class. It lets them demonstrate their understanding of writing, graphing, and comparing linear functions in a format that is less intimidating than a traditional test. It usually takes two, 80 minute, class periods to complete. If you have shorter class periods, you may need to adjust accordingly.

This project is a comprehensive review of linear functions. Students will determine the slope and y-intercept of a function in a variety of contexts and then write the equation of the line in slope-intercept form. This includes:

  • Story Problems
  • Tables
  • Slope and a Point
  • Two Points

Slopes will be positive, negative, zero, and undefined.

Once they've written all sixteen linear functions, they will graph them on the graph paper provided. There is both labeled and unlabeled versions. They will trace over their graphs and create a beautiful piece of stained glass!

The project also includes a section where students are comparing linear functions. The key for both the written work and graph, along with a rubric breakdown, and sample graph are included.

Total Pages
Answer Key
Included
Teaching Duration
2 days
Last updated Apr 11th, 2023
Report this resource to TPT
Reported resources will be reviewed by our team. Report this resource to let us know if this resource violates TPT’s content guidelines.

Standards

to see state-specific standards (only available in the US).
Graph proportional relationships, interpreting the unit rate as the slope of the graph. Compare two different proportional relationships represented in different ways. For example, compare a distance-time graph to a distance-time equation to determine which of two moving objects has greater speed.
Construct a function to model a linear relationship between two quantities. Determine the rate of change and initial value of the function from a description of a relationship or from two (𝘹, 𝘺) values, including reading these from a table or from a graph. Interpret the rate of change and initial value of a linear function in terms of the situation it models, and in terms of its graph or a table of values.
Create equations in two or more variables to represent relationships between quantities; graph equations on coordinate axes with labels and scales.
Graph functions expressed symbolically and show key features of the graph, by hand in simple cases and using technology for more complicated cases.
Graph linear and quadratic functions and show intercepts, maxima, and minima.

Reviews

Questions & Answers

3 Followers