TPT
Total:
$0.00

Linear Equation Anchor Charts and Student Notes Coloring Pages

;
Teaching Math for Tacos
12 Followers
Grade Levels
7th - 9th
Subjects
Standards
Formats Included
  • PDF
Pages
5 pages
$2.00
$2.00
Share this resource
Report this resource to TPT
Teaching Math for Tacos
12 Followers

Description

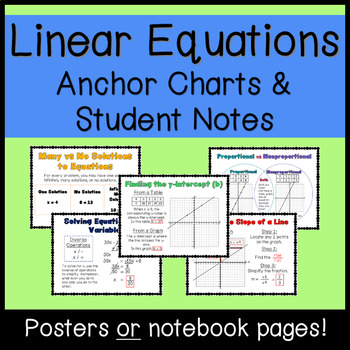
Do your students love coloring? Do you need quick to print posters that can help your students with slope-intercept form? This is for you! This product includes 5 posters related to linear equations. These posters can be printer as large as you want (poster size) or as small as you want (interactive notebook pages)! You could also upload them to your Google Classroom to get your students started!

If you do use Go Math! curriculum, this product can be used throughout Chapters 3-5 as you introduce your students to proportional and non-proportional relationships.

Note: If you do wish to print them on poster size, I do recommend downloading the free version of Adobe Reader DC!

Terms of Use: this product should only be used by the teacher who purchased it. This product is not to be shared with other teachers. Please buy the correct number of licenses if this is to be used by more than one teacher.

Did you know?

You can receive TPT store credits to use on future purchases by leaving feedback on products you buy! Just click on "My Purchases" under "Buy"!

Total Pages
5 pages
Answer Key
N/A
Teaching Duration
N/A
Last updated Nov 15th, 2022
Report this resource to TPT
Reported resources will be reviewed by our team. Report this resource to let us know if this resource violates TPT’s content guidelines.

Standards

to see state-specific standards (only available in the US).
Apply properties of operations as strategies to add, subtract, factor, and expand linear expressions with rational coefficients.
Use variables to represent quantities in a real-world or mathematical problem, and construct simple equations and inequalities to solve problems by reasoning about the quantities.
Graph proportional relationships, interpreting the unit rate as the slope of the graph. Compare two different proportional relationships represented in different ways. For example, compare a distance-time graph to a distance-time equation to determine which of two moving objects has greater speed.
Solve linear equations in one variable.
Give examples of linear equations in one variable with one solution, infinitely many solutions, or no solutions. Show which of these possibilities is the case by successively transforming the given equation into simpler forms, until an equivalent equation of the form 𝘹 = 𝘢, 𝘢 = 𝘢, or 𝘢 = 𝘣 results (where 𝘢 and 𝘣 are different numbers).

Reviews

Questions & Answers