TPT
Total:
$0.00

Intro to Slope and Linear Functions: Guided Notes and BONUS! Poster

Rated 5 out of 5, based on 2 reviews
5.0 (2 ratings)
;
Brooks Jones
118 Followers
Grade Levels
8th - 9th
Standards
Formats Included
  • PDF
Pages
4 w/a 3-page key
$2.29
$2.29
Share this resource
Report this resource to TPT
Brooks Jones
118 Followers

Description

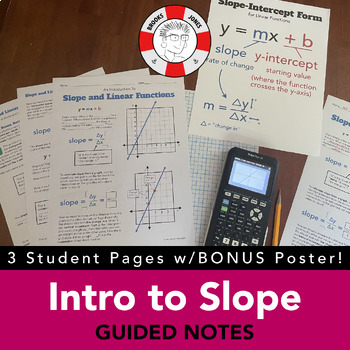
Give your students the best foundation for a solid understanding of slope and linear functions with this fill-in guided notes activity. Students will calculate slope from a graph of a linear function as well as from a table of values, and deconstruct y = mx + b and examine the difference between the y-intercept (b) and slope (m). In addition, students will explore the difference between the dependent variable (y) and independent variable (x) and find out how to analyze a word problem and use a linear function to model a two-variable situation.

Features shown and vocabulary terms defined include slope, rate of change, coefficient, slope-intercept form, y-intercept, solving a two-step, single variable equation, as well as the m- and b-values from the equation. Full key included as well as a bonus classroom poster to keep concepts front of mind for students. This activity aligns with Common Core State Standards 8.F.A.2, 8.F.A.3, and 8.F.B.4, but can be used to review or remediate in higher-level classes such as Algebra I. Full key included. Error-free money-back guarantee!


If you like this resource, please consider following me to get notified of new products and upcoming sales! —-> Click here

Total Pages
4 w/a 3-page key
Answer Key
Included
Teaching Duration
45 minutes
Report this resource to TPT
Reported resources will be reviewed by our team. Report this resource to let us know if this resource violates TPT’s content guidelines.

Standards

to see state-specific standards (only available in the US).
Compare properties of two functions each represented in a different way (algebraically, graphically, numerically in tables, or by verbal descriptions). For example, given a linear function represented by a table of values and a linear function represented by an algebraic expression, determine which function has the greater rate of change.
Interpret the equation 𝘺 = 𝘮𝘹 + 𝘣 as defining a linear function, whose graph is a straight line; give examples of functions that are not linear. For example, the function 𝘈 = 𝑠² giving the area of a square as a function of its side length is not linear because its graph contains the points (1,1), (2,4) and (3,9), which are not on a straight line.
Construct a function to model a linear relationship between two quantities. Determine the rate of change and initial value of the function from a description of a relationship or from two (𝘹, 𝘺) values, including reading these from a table or from a graph. Interpret the rate of change and initial value of a linear function in terms of the situation it models, and in terms of its graph or a table of values.
Create equations in two or more variables to represent relationships between quantities; graph equations on coordinate axes with labels and scales.
Graph linear and quadratic functions and show intercepts, maxima, and minima.

Reviews

Questions & Answers

118 Followers