Interpreting Distance vs. Time Graphs and Speed vs. Time Graphs - 5.P.1 5.P.1.3
The Autry Experiment
121 Followers
Grade Levels
3rd - 12th
Subjects
Resource Type
Formats Included
- PDF
Pages
6 pages
The Autry Experiment
121 Followers
Description
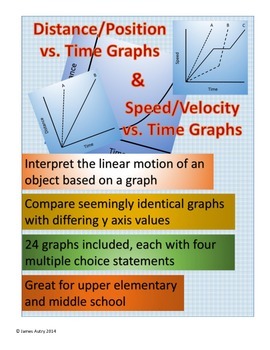
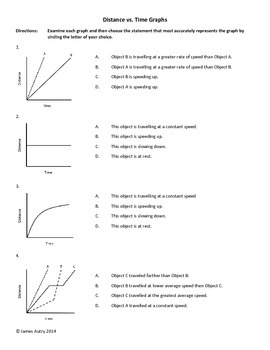
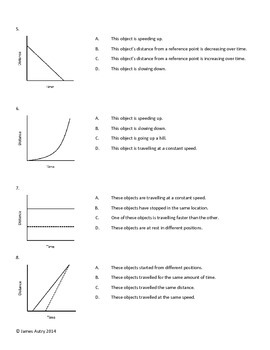
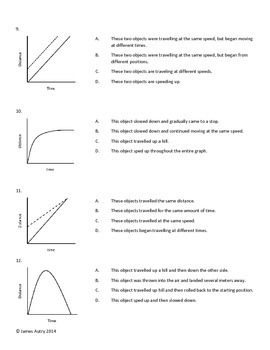
This is an activity that requires students to interpret distance/ position vs. time graphs and speed vs. time graphs. This activity includes 12 distance vs. time graphs and 12 seemingly identical speed vs. time graphs. Students are required to select the most accurate description of each graph from a set of four statements. This activity is designed to illustrate the necessity of paying attention to the axes. The interpretation of a distance vs. time graph may be completely different than the interpretation of an identical speed vs. time graph. This could be used for guided practice, independent practice, assessments, homework, tests, quizzes, study guides, etc. In addition, the graphs themselves can prompt conversations that tap into the higher order thinking skills required on many state tests.
These graphs address linear motion only.
NC Essential Science Standards 5.P.1 and 5.P.1.3
***Please Read***
This activity is included in one of my other products, "Calculating Speed, Time, Distance, and Graphing Motion." It includes several additional activities and informative text to help your students understand how motion is calculated and graphed. If you would like to purchase a more comprehensive packet, it is available for $5.00 at The Autry Experiment.
Total Pages
6 pages
Answer Key
Included
Teaching Duration
N/A
Report this resource to TPT
Reported resources will be reviewed by our team. Report this resource to let us know if this resource violates TPT’s content guidelines.


