Immigration - Charts and Graphs (Mexico)
- PDF
- Easel Activity
Description
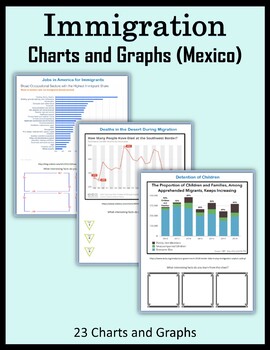
23 printable or digital pages for students to analyze and describe charts and graphs related to IMMIGRATION:
- Border crossing apprehensions,
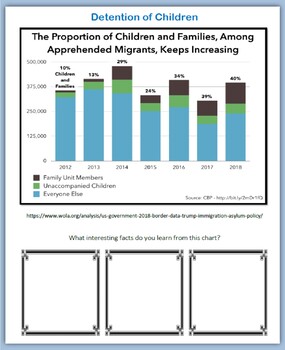
- Children and families among migrants,
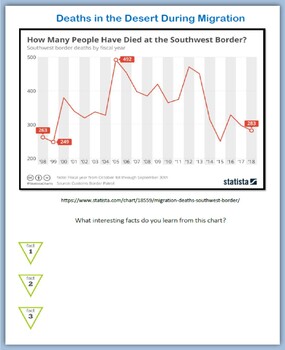
- Deaths in southwest desert,
- Locations where Mexicans settle in the US,
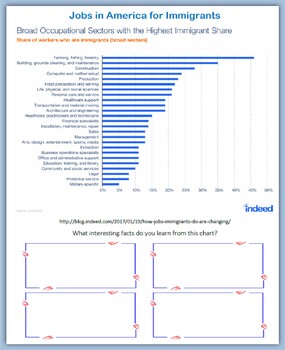
- Typical jobs taken by recent immigrants to the US,
- Literacy rates in Mexico,
- Vehicle imports from Mexico,
- Minimum wage globally,
- Tourism in Mexico,
- Importing vs exporting food,
- Age distribution in Mexico,
- Energy and wind power in Mexico,
- Immigrants sending money back to Mexico,
- US investing dollars in Mexico (policing and economic assistance),
- and more...
PRINT: I created a PDF version that you can download on your computer and print for students to use in class or at home. Click on "Add one to cart" and download your copy.
DIGITAL ACTIVITY: I created a digital version with text boxes so students can type in the answers using a computer or tablet (for Distance Learning). Click on "Create Digital Activity" and link the activities to your Google Classroom. Online Resource. Yes, I already added the interactive layer to each page. Enjoy!
Take a look at the Preview to see sample pages. And if you want more on IMMIGRATION, take a look at these materials:
Immigration - Describing Photos of the US-Mexico Border - 52 pages
Immigration - Analyzing What Politicians Say - 41 pages
Immigration - Charts and Graphs (Mexico) - 23 pages
Immigration - Writing Prompts (Mexico) - 23 pages
Immigration Issues - Internet Research Projects for High School - 22 pages
Immigration and the Law - Internet Research Projects for High School - 31 pages
Immigration and the Border - Internet Research Projects for High School - 21 pages
And if you want more CHARTS and GRAPHS:
Food Charts and Graphs - 21 pages
Winter Weather Charts and Graphs - 20 pages
Christmas Charts and Graphs - 20 pages
Winter Olympics (Reading Charts and Graphs) - 10 pages
Presidents' Day - Analyzing Charts and Graphs - 22 pages
Immigration - Charts and Graphs (Mexico) - 23 pages
Covid-19 (Coronavirus) Analyzing Charts and Graphs - 58 pages
Mushrooms - Charts and Graphs, Describing, Compare and Contrast, Writing - 11 pages
Global Warming and Solar Energy - Analyzing Charts and Graphs - 17 pages
Global Warming and Wind Power - Analyzing Charts and Graphs - 17 pages
Global Warming and Animals - Analyzing Charts and Graphs - 15 pages
Global Warming and Coal - Analyzing Charts and Graphs - 15 pages
Global Warming and the Ocean - Analyzing Charts and Graphs - 15 pages
Global Warming and Temperature - Analyzing Charts and Graphs - 13 pages
Global Warming and Glaciers - Analyzing Charts and Graphs - 11 pages
Global Warming and Transportation - Analyzing Charts + Graphs - 15 pages
Global Warming and Trash - Analyzing Charts + Graphs - 16 pages


