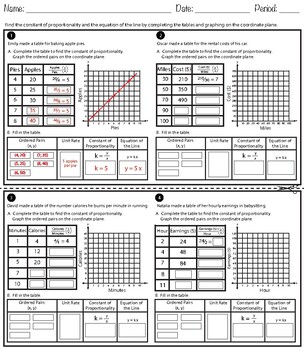
Identifying Constant of Proportionality Using Tables, Graphs and Equations
Maricel Talosig
16 Followers
Resource Type
Standards
CCSS7.RP.A.2b
CCSS7.RP.A.2d
Formats Included
- PDF
Pages
8 pages
Maricel Talosig
16 Followers
What educators are saying
I love how the notes and the work is very well organized along with the activities. Students learned well and followed along, ending the year on an absolute High note.
Several different styles to review constant of proportionality. Several ways to differentiate for your students.
Description
These worksheets can be served as a graphic organizer or a handout to practice in identifying constant of proportionality (unit rate) using tables, graphs, equations and verbal descriptions of proportional relationships. Students will make tables of equivalent ratios, find missing values in the tables, and plot the pairs of values on the coordinate plane to identify the constant of proportionality. Students will also select statements which is true or false in interpreting a point (x, y) on the graph of a proportional relationship with special attention to the points (0, 0) and (1, k) where k is the unit rate or the constant of proportionality.
Total Pages
8 pages
Answer Key
Included
Teaching Duration
2 days
Report this resource to TPT
Reported resources will be reviewed by our team. Report this resource to let us know if this resource violates TPT’s content guidelines.
Standards
to see state-specific standards (only available in the US).
CCSS7.RP.A.2b
Identify the constant of proportionality (unit rate) in tables, graphs, equations, diagrams, and verbal descriptions of proportional relationships.
CCSS7.RP.A.2d
Explain what a point (𝘹, 𝘺) on the graph of a proportional relationship means in terms of the situation, with special attention to the points (0, 0) and (1, 𝘳) where 𝘳 is the unit rate.


