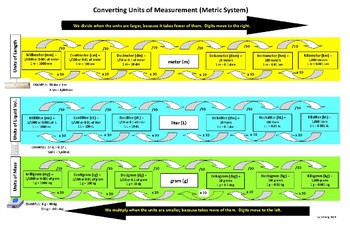
Hands-on Metric Conversion Chart for 4th, 5th, 6th Math Students
Concepts and Copy by Lucy Ewing
5 Followers
Grade Levels
4th - 6th
Subjects
Resource Type
Standards
CCSS4.MD.A.1
CCSS5.MD.A.1
CCSS5.MD.B.2
CCSS4.NBT.A.2
Formats Included
- PDF
Pages
1 page
Concepts and Copy by Lucy Ewing
5 Followers
What educators are saying
I copied these using a color copier and I laminated them. They are very helpful for working with conversions, especially for the students who have to have something to look at because they can't quite memorize the order.
Description
This visual chart makes clear and easy how digits shift to larger or smaller units of metric measure--for length, liquid volume and mass. Students will have a deeper understanding of place value, decimal numbers, and the metric system as they shift digits to the left (multiplication) or the right (division) the number of arrow hops between metric measures. This chart corresponds directly with the Math Expressions program for Common Core, Unit 5 (fourth grade) and Unit 8 (fifth grade), and is a great reference for students, teachers, and families.
Total Pages
1 page
Answer Key
N/A
Teaching Duration
Lifelong tool
Report this resource to TPT
Reported resources will be reviewed by our team. Report this resource to let us know if this resource violates TPT’s content guidelines.
Standards
to see state-specific standards (only available in the US).
CCSS4.MD.A.1
Know relative sizes of measurement units within one system of units including km, m, cm; kg, g; lb, oz.; l, ml; hr, min, sec. Within a single system of measurement, express measurements in a larger unit in terms of a smaller unit. Record measurement equivalents in a two-column table. For example, know that 1 ft is 12 times as long as 1 in. Express the length of a 4 ft snake as 48 in. Generate a conversion table for feet and inches listing the number pairs (1, 12), (2, 24), (3, 36),...
CCSS5.MD.A.1
Convert among different-sized standard measurement units within a given measurement system (e.g., convert 5 cm to 0.05 m), and use these conversions in solving multi-step, real world problems.
CCSS5.MD.B.2
Make a line plot to display a data set of measurements in fractions of a unit (1/2, 1/4, 1/8). Use operations on fractions for this grade to solve problems involving information presented in line plots. For example, given different measurements of liquid in identical beakers, find the amount of liquid each beaker would contain if the total amount in all the beakers were redistributed equally.
CCSS4.NBT.A.2
Read and write multi-digit whole numbers using base-ten numerals, number names, and expanded form. Compare two multi-digit numbers based on meanings of the digits in each place, using >, =, and < symbols to record the results of comparisons.


