TPT
Total:
$0.00

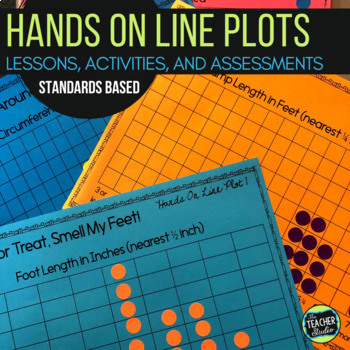
Hands On Line Plot Activities, Investigations and Line Plot Assessments

Rated 4.88 out of 5, based on 410 reviews
4.9 (410 ratings)
;
The Teacher Studio
17.8k Followers
Grade Levels
3rd - 5th
Standards
Formats Included
  • PDF
Pages
45 pages
$7.50
$7.50
Share this resource
Report this resource to TPT
The Teacher Studio
17.8k Followers

What educators are saying

Thank you for making resources that don't have tons of primary looking clipart and are therefore sophisticated for 4th graders. My kids also love how this really made line plots make sense. The dot stickers helped them to see how it all works. Thanks so much!
My students loved the hands-on stations, and the other worksheets were great at helping us understand and interpret line plots. The resource was well organized and easy to use. Definitely recommend!

Description

Do you struggle to find quality line plot resources that are fun AND instructional? Line plots are a key part of many sets of math standards for intermediate grades—but many textbooks give very limited opportunities for meaningful math practice with them.

This resource is designed to get students interpreting line plots, making line plots, collecting data, and more! Includes line plots with whole numbers AND line plots with fractions. Line plots actually address so many math concepts--and these activities even make them fun!

My students have a blast with the different activities and really were able to show their math thinking on the practice pages. We had tons of great math talk, and the opportunities for students to really “study” the graphs really helped them construct meaning—not merely fill in the blanks.

This resource is divided into FOUR main sections:

1. “Interpreting Line Plots

This section has 5 different reproducible line plots with questions to help the students think deeply about the data. Each one also has a place for students to generate their OWN questions about the graph—great for class discussions or partner and small group work.

2. “Hands On Line Plots”

This section has 5 hands on “explorations” where students generate data and create class line plots that they then work to study and analyze. Suggestions for use are included as are both customary and metric versions where appropriate.

3. “Making Line Plots”

In this section, students are given 5 different sets of data to use to “plot”—many of which use fractions. Gridded and “open” line plot pages are included so students can either use a preplanned scale or you can work as a class or in small groups to create your own scales that match the data. Question pages are also included to do additional data analysis once the line plots are created.

4. “Assessing Line Plots”

Although any of the other pages could certainly be used as assessments (and these can be used as practice pages), it’s sometimes nice to have a place for students to work independently to “show what they know”. I have included 5 different assessments that ask questions and present data in different ways.

I hope you find it a fun, rigorous, and meaningful way to get your students truly thinking about data and line plots! Selected answers included where applicable. Page count is approximate. The actual document has far more but some are different versions of certain pages.

What are teachers saying?

  • "LOVED this resource!! So easy to use as station rotations during our math time, and a great hands-on way to practice line plots and data collection/organization."

  • "My students were having trouble understanding line plots. This hands on activity really helped them to make progress and gave them concrete understanding of the skill. I am so glad I bought this!"

  • "Amazing scaffolding included! My kids were so engaged and had so much fun! Thank you!"

  • "Line plots can be a struggle to teach but this resource has everything you need! Thank you!"

  • "WOW, lots of resources here, and lots of fun was had by my students. Thanks!"

---------------------------------------------------------------------------------------

Want to check out a different graphing resource?

GREAT GRAPHS: Constructivist Graph Unit

How about some other measurement resources?

Teaching Tandem: Area and Perimeter

Measurement Task Cards

---------------------------------------------------------------------------------------

All rights reserved by ©The Teacher Studio. Purchase of this resource entitles the purchaser the right to reproduce the pages in limited quantities for single classroom use only. Duplication for an entire school, an entire school system, or commercial purposes is strictly forbidden without written permission from the author at fourthgradestudio@gmail.com. Additional licenses are available at a reduced price.

Total Pages
45 pages
Answer Key
Included
Teaching Duration
N/A
Report this resource to TPT
Reported resources will be reviewed by our team. Report this resource to let us know if this resource violates TPT’s content guidelines.

Standards

to see state-specific standards (only available in the US).
Generate measurement data by measuring lengths using rulers marked with halves and fourths of an inch. Show the data by making a line plot, where the horizontal scale is marked off in appropriate units-whole numbers, halves, or quarters.
Make a line plot to display a data set of measurements in fractions of a unit (1/2, 1/4, 1/8). Solve problems involving addition and subtraction of fractions by using information presented in line plots. For example, from a line plot find and interpret the difference in length between the longest and shortest specimens in an insect collection.
Make a line plot to display a data set of measurements in fractions of a unit (1/2, 1/4, 1/8). Use operations on fractions for this grade to solve problems involving information presented in line plots. For example, given different measurements of liquid in identical beakers, find the amount of liquid each beaker would contain if the total amount in all the beakers were redistributed equally.
Make sense of problems and persevere in solving them. Mathematically proficient students start by explaining to themselves the meaning of a problem and looking for entry points to its solution. They analyze givens, constraints, relationships, and goals. They make conjectures about the form and meaning of the solution and plan a solution pathway rather than simply jumping into a solution attempt. They consider analogous problems, and try special cases and simpler forms of the original problem in order to gain insight into its solution. They monitor and evaluate their progress and change course if necessary. Older students might, depending on the context of the problem, transform algebraic expressions or change the viewing window on their graphing calculator to get the information they need. Mathematically proficient students can explain correspondences between equations, verbal descriptions, tables, and graphs or draw diagrams of important features and relationships, graph data, and search for regularity or trends. Younger students might rely on using concrete objects or pictures to help conceptualize and solve a problem. Mathematically proficient students check their answers to problems using a different method, and they continually ask themselves, "Does this make sense?" They can understand the approaches of others to solving complex problems and identify correspondences between different approaches.
Reason abstractly and quantitatively. Mathematically proficient students make sense of quantities and their relationships in problem situations. They bring two complementary abilities to bear on problems involving quantitative relationships: the ability to decontextualize-to abstract a given situation and represent it symbolically and manipulate the representing symbols as if they have a life of their own, without necessarily attending to their referents-and the ability to contextualize, to pause as needed during the manipulation process in order to probe into the referents for the symbols involved. Quantitative reasoning entails habits of creating a coherent representation of the problem at hand; considering the units involved; attending to the meaning of quantities, not just how to compute them; and knowing and flexibly using different properties of operations and objects.

Reviews

Questions & Answers

17.8k Followers