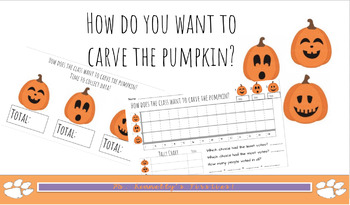
Halloween Pumpkin Carving Graphing Activity! (Google Slides)
Ms Kennellys Firsties
74 Followers
Grade Levels
PreK - 3rd
Subjects
Resource Type
Standards
CCSSK.MD.B.3
CCSS1.MD.C.4
CCSS2.MD.D.10
CCSS3.MD.B.3
Formats Included
- Google Slides™
Pages
4 pages
Ms Kennellys Firsties
74 Followers

Made for Google Drive™
This resource can be used by students on Google Drive or Google Classroom. To access this resource, you’ll need to allow TPT to add it to your Google Drive. See our FAQ and Privacy Policy for more information.
What educators are saying
My students enjoyed this activity. It went along with our voting unit. I also appreciated that the carving choices were easy. Thank you!
Description
Use this fun Halloween Graphing Activity to allow your students to show what they know about Graphing! You can have this lesson prior to carving a pumpkin with your class. It is a great way to have the students vote!
Total Pages
4 pages
Answer Key
N/A
Teaching Duration
40 minutes
Last updated Oct 21st, 2019
Report this resource to TPT
Reported resources will be reviewed by our team. Report this resource to let us know if this resource violates TPT’s content guidelines.
Standards
to see state-specific standards (only available in the US).
CCSSK.MD.B.3
Classify objects into given categories; count the numbers of objects in each category and sort the categories by count.
CCSS1.MD.C.4
Organize, represent, and interpret data with up to three categories; ask and answer questions about the total number of data points, how many in each category, and how many more or less are in one category than in another.
CCSS2.MD.D.10
Draw a picture graph and a bar graph (with single-unit scale) to represent a data set with up to four categories. Solve simple put-together, take-apart, and compare problems using information presented in a bar graph.
CCSS3.MD.B.3
Draw a scaled picture graph and a scaled bar graph to represent a data set with several categories. Solve one- and two-step “how many more” and “how many less” problems using information presented in scaled bar graphs. For example, draw a bar graph in which each square in the bar graph might represent 5 pets.


