Graphing with Slope Intercept Form_DIGITAL NOTES & 2 Quizzes (GOOGLE)
Math Made Modern
512 Followers
Resource Type
Standards
CCSS8.F.A.3
CCSS8.F.B.4
CCSS8.F.B.5
CCSSHSF-LE.A.2
Formats Included
- PDF
- Google Apps™
- Internet Activities
Pages
30 pages
Math Made Modern
512 Followers

Includes Google Apps™
The Teacher-Author indicated this resource includes assets from Google Workspace (e.g. docs, slides, etc.).
Also included in
- Want to go digital with Google? This bundle is your one-stop-shop for 8th grade math digital notes using Google Slides and digital quizzes using Google Forms. The bundle includes everything you need for 8th grade math, plus you will receive new digital notes and quizzes throughout the year. IncludPrice $175.28Original Price $194.75Save $19.47
Description
Product Description
Google Slides Digital Interactive Notes. The notes are everything beneficial of an interactive notebook without all the paper, glue, scissors, etc.
Content:
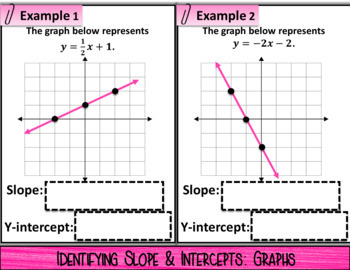
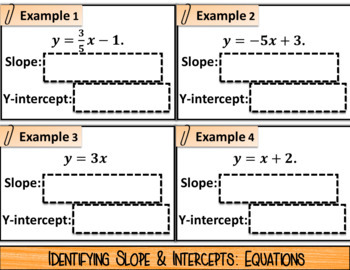
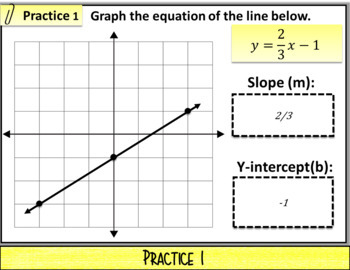
Students will be able to graph equations of the line in slope intercept form.
Includes:
Google Slides: Graphing with Slope Intercept Form Digital Notes
Google Forms: Self Grading Quick Check Quiz 1 & Self Grading Quick Check Quiz 2
Answer Key
Teacher Edition included
Total Pages
30 pages
Answer Key
Included
Teaching Duration
45 minutes
Report this resource to TPT
Reported resources will be reviewed by our team. Report this resource to let us know if this resource violates TPT’s content guidelines.
Standards
to see state-specific standards (only available in the US).
CCSS8.F.A.3
Interpret the equation 𝘺 = 𝘮𝘹 + 𝘣 as defining a linear function, whose graph is a straight line; give examples of functions that are not linear. For example, the function 𝘈 = 𝑠² giving the area of a square as a function of its side length is not linear because its graph contains the points (1,1), (2,4) and (3,9), which are not on a straight line.
CCSS8.F.B.4
Construct a function to model a linear relationship between two quantities. Determine the rate of change and initial value of the function from a description of a relationship or from two (𝘹, 𝘺) values, including reading these from a table or from a graph. Interpret the rate of change and initial value of a linear function in terms of the situation it models, and in terms of its graph or a table of values.
CCSS8.F.B.5
Describe qualitatively the functional relationship between two quantities by analyzing a graph (e.g., where the function is increasing or decreasing, linear or nonlinear). Sketch a graph that exhibits the qualitative features of a function that has been described verbally.
CCSSHSF-LE.A.2
Construct linear and exponential functions, including arithmetic and geometric sequences, given a graph, a description of a relationship, or two input-output pairs (include reading these from a table).


