
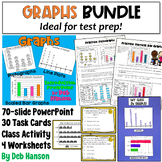
Graphing Task Cards: Scaled Picture & Bar Graphs, Line Plots 3rd Grade Practice


- PDF
- Easel Activity
- Easel Assessment
What educators are saying
Also included in
 This graphing bundle has everything you need to teach third and fourth-grade students about representing and interpreting data. The activities in this math bundle make learning how to interact with common types of graphs fun and easy! Students love the activities while teachers love the conveniencePrice $9.99Original Price $16.99Save $7.00
Learning Objective
Students will solve 1- and 2-step problems with data represented with a frequency table, scaled picture graphs, scaled bar graphs, and line plots.
Description
Graphing Task Cards: This set of 30 task cards is designed to give your third-grade students the opportunity to practice solving a variety of graph and data questions written in a multiple-choice format. Students will have many opportunities to interpret various types of graphs. It includes scaled bar graphs in both vertical and horizontal orientations. Scaled picture graphs and line plots are also included. For each graph provided, three questions follow.
Students will interact with the data on:
✅ 3 vertical scaled bar graphs
✅ 2 horizontal scaled bar graphs
✅ 3 scaled picture graphs
✅ 2 line plots
I encourage you to take a peek at the PREVIEW!! It shows the format of the task cards. You will see that each task card page contains a graph (or line plot) in the upper left box, and then contains three multiple-choice questions in the three remaining boxes. In total, this set contains 10 graphs and 30 questions. This set was created to match the 3rd grade Common Core state standards for representing and interpreting data (3MD.B.3 and 3MD.B.4).
Like most of my task card sets, I have included a game-like answer sheet in addition to the more traditional recording sheet. On this game-like sheet, students help a family determine where their next vacation will be. Whenever they select an A answer, they draw a tally by the A destination. Whenever they select a B answer, they draw a tally by the B destination. Whichever destination receives the most tallies is the chosen city. As an added bonus, students create a vertical bar graph based on their tallies. An answer key for the recording sheet is included.
Many teachers report posting the task cards around the room to give their students an opportunity to get up and walk around the room. Others say that they use these as a whole class formative activity where they place a task card under their doc cam, and then have students write their chosen answer on whiteboards. Both activities provide an engaging alternative to a traditional worksheet activity!
********This resource is available in three formats:
- Traditional Printables- Print the PDF and distribute paper task cards and recording sheet.
- Easel Activity- With this digital format, there is one task card per slide (30 slides in all). Students can complete this activity on a device. Students read each question, study the graph, and select the best answer for the task presented. This has a multiple-choice format, and students push the button that displays the correct answer. No checking is necessary! When your students turn it in, you will see their score and the number of attempts they made on each card.
- Easel Assessment- Students complete this self-grading quiz on a device, as well. After reading each question, students select the answer from a list of three possible answer choices. With this option, the teacher chooses whether or not his or her students receive immediate feedback.
Here's what teachers like you had to say about using these task cards with their students:
⭐️ Shania H. said, "Loved using this tool to see what my fourth graders already knew and what we needed to review. Great resource and can be used in many different ways."
⭐️ Cathleen I said, "I LOVE how it asks more than one question per graph/chart. It really helps the kids dig into what they are seeing."
⭐️ Math and More in 104 said, "I loved these task cards - they were exactly what I was looking for. I really like having multiple questions about 1 graph on 1 page. I also liked the variety of questions you included."
⭐️ Megan K. said, "My students enjoyed practicing using the concepts they've learned about scaled graphs to complete this activity!"
***If you would like to have a Google Slides and/or Google Forms version of this activity, click on these links to access the digital version or the bundle.
You can also click on the following link to check out my related PowerPoint and craftivity:
Graphs PowerPoint (including a 6-page companion handout!)
Class Graphing Activity: Bar Graphs, Line Plot, and Pictograph
Four Graphing Practice Worksheets
Copyright by Deb Hanson
This item is a paid digital download from my TpT store
www.teacherspayteachers.com/Store/Deb-Hanson
This product is to be used by the original downloader only. Copying for more than one teacher is prohibited. This item is also bound by copyright laws. Redistributing, editing, selling, or posting this item (or any part thereof) on an Internet site that is not password protected are all strictly prohibited without first gaining permission from the author. Violations are subject to the penalties of the Digital Millennium Copyright Act. Please contact me if you wish to be granted special permissions!
