
Graphing Lines and Killing Zombies ~ Graphing in Slope Intercept Form Activity


- PDF
- Google Apps™

What educators are saying
Also included in
 This bundle includes all the notes, worksheets, & activities in my store that pertain to 8th Grade Mathematics.Does this Include Digital Resources?As of May 2024 over 80% of this bundle includes a digital Google Slides or Forms option.Please view the preview to view the content list & whichPrice $115.00Original Price $222.50Save $107.50
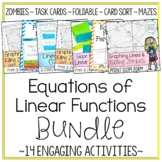 With this bundle you get my 14 Equations of Linear Functions activities. Save money by buying the bundle and be prepared for an entire unit of engaging activities!-------------------------------------------------------------------------------------------------------Sign up for mySecondary Math NewsPrice $22.75Original Price $33.00Save $10.25
 This bundle includes all the worksheets & activities in my store that pertain to Algebra 1.Does this Include Digital Resources?As of May 2024 over 80% of this bundle includes a digital Google Slides or Forms option.Please view the preview to view the content list & which resources include aPrice $120.00Original Price $233.00Save $113.00
Description
This distance learning ready zombie themed graphing linear equations activity will strengthen your students’ skills at graphing in slope intercept form.
Distance learning?
- No problem! This activity now includes a Google Slides digital option!
- Explore the ⌨ Distance Learning in my store for more digital resources
After many requests a "Catching Zombies" version has been added. It's the exact same activity and problems but replaces the word "Killing" for "Catching". It's included in the resource download after purchase.
Other Holidays Available
- Thanksgiving -> Graphing Lines & Catching Turkeys
- Christmas -> Graphing Lines & Catching Elves
- Valentines Day -> Graphing Lines & Cupid's Arrow
How it Works- Students are given a graph with 12 zombies on it and 12 y=mx+b equations. Students will cut out each equation and graph the line on the zombie graph. They will then glue the equation next to the zombie that it “killed”. Zombies are “killed” when a line runs through any part of their body. Precision is key in this activity as each line should only run through 1 zombie. If a line runs through more than 1 zombie the student was not precise enough.
Need a Warm Up? Check out The Warm Up To… Graphing Lines & Killing Zombies
Please view the preview for an exact picture of the completed activity.
Also Available in Spanish
Líneas Gráfica y Matando Zombies - Forma de Intersección de la Pendiente
Related Resources
Writing Linear Equations in Slope Intercept Form Task Cards
Linear Equation Card Match (Slope Intercept Form)
Other Forms of Linear Equations Also Available
- Point Slope Form -> Graphing Lines & Killing Zombies - Point Slope Form
- Standard Form -> Graphing Lines & Killing Zombies - Standard Form
- All 3 Forms -> Graphing Lines & Killing Zombies - All 3 Forms
Similar Activities
o Click Here for more Zombie Math activities
o Click Here for more Functions & Linear Equations activities
o Click Here for more End of Year activities
This product is also part of the following money saving bundles
Equations of Linear Functions Activity Bundle
8th Grade Math Bundle - All My 8th Grade Math Products for 1 Low Price
Algebra 1 Bundle ~ All My Algebra Products for 1 Low Price
Find the resource you need quickly & easily....
Download the FREE Amazing Mathematics Resource Catalog Today!
- Resource Catalog - 6th Math
- Resource Catalog - 7th Math
- Resource Catalog - 8th Math
- Resource Catalog - Algebra
- Resource Catalog - Geometry
-------------------------------------------------------------------------------------------------------
Sign up for my Secondary Math Newsletter
to receive a Free Pi-Rate Plotting Points picture.
-------------------------------------------------------------------------------------------------------
©Copyright Amazing Mathematics LLC
This product is to be used by the original purchaser only.
This product can NOT be uploaded to the internet by the purchaser.
Doing so is a violation of the copyright of this product.
Copying for more than one teacher, or for an entire department, school,
or school system is prohibited.
This product may not be distributed or displayed digitally for public view, uploaded to school or district websites, distributed via email, or submitted to file sharing sites.
The unauthorized reproduction or distribution of a copyrighted work is illegal.
Criminal copyright infringement, including infringement without monetary gain, is investigated by the FBI and is punishable by fines and federal imprisonment.
