TPT
Total:
$0.00

Graphing Linear Functions in Slope Intercept Form

;
Beautiful Mathematics
114 Followers
Grade Levels
7th - 9th, Homeschool
Resource Type
Standards
Formats Included
  • PDF
Pages
4 pages
$2.00
$2.00
Share this resource
Report this resource to TPT
Beautiful Mathematics
114 Followers
Also included in
  1. Visualize the number system, linear functions, and geometric shapes with student-friendly graphic organizers, number lines, concept mapping, and paper constructions. The perfect packet for busy teachers and inquisitive students! This bundle is standards-based and designed specifically for the 8th
    Price $45.00Original Price $48.45Save $3.45

Description

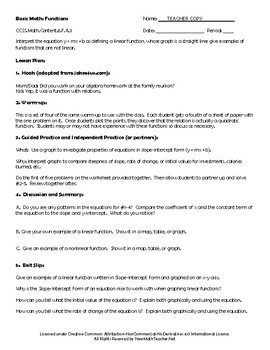
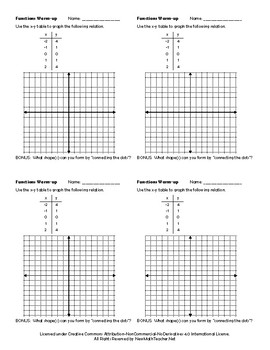
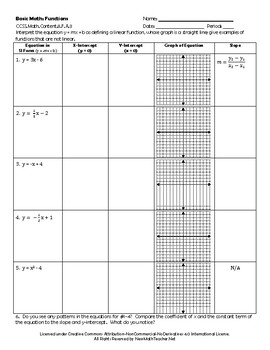
Students will interpret the equation y = mx + b as defining a linear function, whose graph is a straight line. They will also work with examples of functions that are not linear.

Provide feedback and get TPT credit on future purchases:

***Go to your My Purchases page. Click on the Provide Feedback button beside each purchase. You will be taken to a page where you can give a quick rating and leave a short comment for the product. By giving feedback, you gain TPT feedback credits that lower the cost of future purchases. Thank you for your feedback!

Follow me to hear about new discounts, freebies and product launches:

***Click on the green star next to my store logo to become a follower. Thanks for following!

Licensed under Creative Commons Attribution-NonCommercial-NoDerivatives 4.0 International License.

Total Pages
4 pages
Answer Key
N/A
Teaching Duration
55 minutes
Report this resource to TPT
Reported resources will be reviewed by our team. Report this resource to let us know if this resource violates TPT’s content guidelines.

Standards

to see state-specific standards (only available in the US).
Interpret the equation 𝘺 = 𝘮𝘹 + 𝘣 as defining a linear function, whose graph is a straight line; give examples of functions that are not linear. For example, the function 𝘈 = 𝑠² giving the area of a square as a function of its side length is not linear because its graph contains the points (1,1), (2,4) and (3,9), which are not on a straight line.
Construct a function to model a linear relationship between two quantities. Determine the rate of change and initial value of the function from a description of a relationship or from two (𝘹, 𝘺) values, including reading these from a table or from a graph. Interpret the rate of change and initial value of a linear function in terms of the situation it models, and in terms of its graph or a table of values.

Reviews

Questions & Answers

114 Followers