Graphing Exponential Functions and Identify Key Features Worksheet
Almighty Algebra
26 Followers
Resource Type
Standards
CCSSHSF-IF.B.4
CCSSHSF-IF.C.7e
CCSSHSF-IF.C.9
Formats Included
- PDF
Pages
6 pages
Almighty Algebra
26 Followers
Description
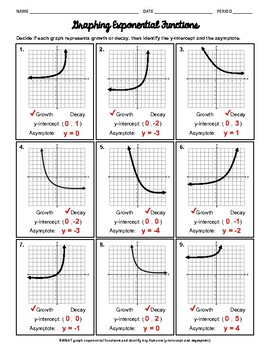
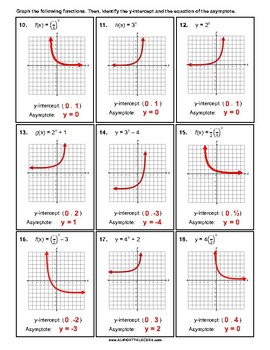
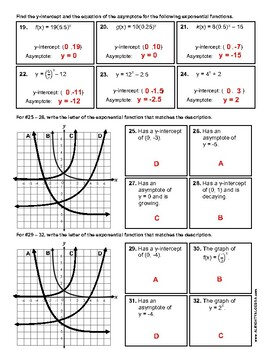
32 question worksheet on graphing exponential functions and identifying key features like the asymptote and the y-intercept.
- #1 - 9: Given the graph of an exponential function, determine if the graph represents growth or decay, identify the y-intercept, and determine the equation of the asymptote.
- #10 - 18: Given the equation, graph the exponential function and identify the y-intercept and the equation of the asymptote.
- #19 - 24: Given the equation, identify the y-intercept and the equation of the asymptote; these numbers are larger and contain fractions/decimals.
- #25 - 28: Match the graph of an exponential function to a written description (for example- "has a y-intercept of (0, 1) and is decaying").
- #29 - 32: Match the graph of an exponential function to a written description (for example- "has an asymptote of y=-4").
Answer key included.
VISIT US AT WWW.ALMIGHTYALGEBRA.COM FOR MORE RESOURCES AND BUNDLED DISCOUNTS!!
Total Pages
6 pages
Answer Key
Included
Teaching Duration
N/A
Report this resource to TPT
Reported resources will be reviewed by our team. Report this resource to let us know if this resource violates TPT’s content guidelines.
Standards
to see state-specific standards (only available in the US).
CCSSHSF-IF.B.4
For a function that models a relationship between two quantities, interpret key features of graphs and tables in terms of the quantities, and sketch graphs showing key features given a verbal description of the relationship.
CCSSHSF-IF.C.7e
Graph exponential and logarithmic functions, showing intercepts and end behavior, and trigonometric functions, showing period, midline, and amplitude.
CCSSHSF-IF.C.9
Compare properties of two functions each represented in a different way (algebraically, graphically, numerically in tables, or by verbal descriptions). For example, given a graph of one quadratic function and an algebraic expression for another, say which has the larger maximum.


