


- PDF
Also included in
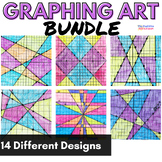 This no prep bundle lets students show their creativity while still practicing important graphing equation skills! Students will practice a variety of concepts including using slope-intercept form, parallel and perpendicular lines, systems of equations, and more. Best of all they also make beautifuPrice $10.50Original Price $15.00Save $4.50
Description
Engage your pre-algebra or algebra students with this free math art activity. Students will practice graphing equations using a table. Not only are there two different options to help differentiate, but the results are beautiful stained glass type images to hang in your classroom.
This freebie is a sample of my graphing art bundle. Click here to see more!
Your students will love this "break" from their regular math routine. This activity is a perfect way to either begin graphing linear equations or for a review of graphing. You can also use this for a substitute teacher or during a shortened class period.
Check out what other teachers are saying about this graphing art activity:
"Thank you for sharing this. It's the perfect number of equations and the results are something the students will enjoy coloring."
"Wow! This is exactly what I was looking for!"
"My students loved this activity!! Very easy to see if they graphed correctly also. Great resource I will use with all my classes."
"LOVE this activity! So many skills students are practicing and they get to show their creativity as well! Thank you for this great resource!"
You may also be interested in some of my other math resources below:
Slope and Linear Equations Guided Notes Bundle
Click here to follow me for updates on new products that are always 50% off for the first 24 hours.
