Gráficas y Datos Interpreta Crea y Analiza diferente tipos de gráficas
- PDF
What educators are saying
Description
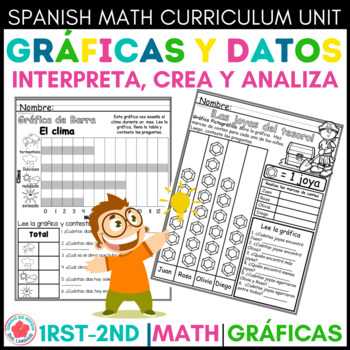
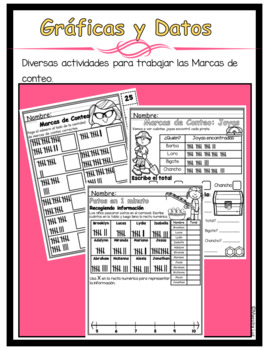
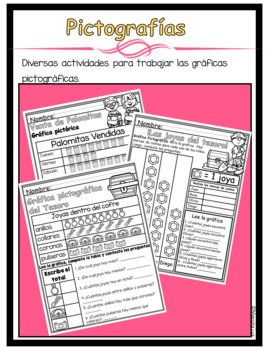
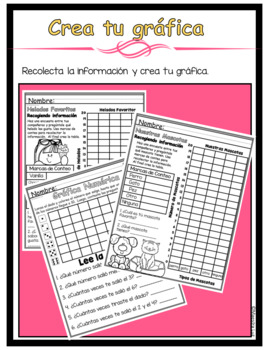
Este paquete de datos y gráficas está equipado con diferentes hojas de trabajo para ayudar a tus estudiantes a divertirse mientras aprenden a leer, analizar y crear sus gráficas. Aprenderán una variedad de destrezas que incluye: marcas de conteo, leer los datos, gráfica de barras y más. Hay un total de 20 hojas de trabajo para trabajar el tema.
El paquete incluye:
- Marcas de Conteo, Tally Marks
- Categorización de Datos, Data Categories
- Gráficas, Categorize and Graph
- Gráfica de Marcas de conteo Read Tally Chart and answer questions
- Crea la gráfica usando datos, Create a tally chart using the data from the bar graph Graph – Tally the totals and interpret the graph.
- Length Line Plot – Read the line plot and answer the questions.
Otros materiales disponibles en mi tienda son:
Sígueme en mi tienda para recibir notificaciones de nuevos productos. Click Here
- sonrisasqueinspirandl@gmail.com
- https://www.instagram.com/lucecitalunera/
- https://twitter.com/DLsonrisas
______________________ VERY IMPORTANT______________________
You can receive TPT store credits to use on future purchases by leaving feedback on any products you buy! Click on "My Purchases" to access the feedback link. I really appreciate your support, please leave feedback on my products. Your feedback will ensure I make the very best products for you and your students!
TERMS OF USE In downloading this teacher resource, you agree that you are purchasing a single user license for personal classroom only and does not give you copyright. All teaching materials sold by Sonrisas que Inspiran Dual Language may not be adapted, re-sold, distributed, or translated into any other language for re-sale. You may not remove the graphic credit in any of your teaching materials.
If you are interested in other writing activities, please visit my other writing products in my shop:
Sígueme en Instagram para tener la oportunidad de ganar rifas o de recibir ideas para llevar a cabo en tu salón.
https://www.instagram.com/lucecitalunera/
IEIN: 8346874


