TPT
Total:
$0.00

Grade 3-5 Math Anchor Charts

Rated 4.89 out of 5, based on 285 reviews
4.9 (285 ratings)
;
Math Facts and Backpacks
503 Followers
Grade Levels
3rd - 6th, Homeschool
Resource Type
Standards
Formats Included
  • PDF
Pages
33 pages
$12.00
List Price:
$15.00
You Save:
$3.00
$12.00
List Price:
$15.00
You Save:
$3.00
Share this resource
Report this resource to TPT
Math Facts and Backpacks
503 Followers

What educators are saying

Great resource for my students to reinforce the lessons and take notes. I put them on their google classroom so parents can see them as well.
Great anchor charts with clear examples and easy-to-understand explanations. I have them laminated and post them on the whiteboard when they go with our unit of study. The kids refer to them frequently. Very pleased with this purchase.

Description

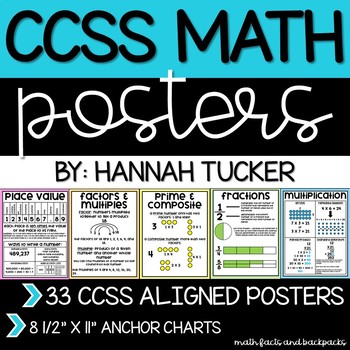
This CCSS aligned math product contains 33 posters perfect for miniature anchor charts, classroom decoration, and quick reference guides for students! Topics from all 5 domains are included: Operations and Algebraic Thinking, Numbers and Operations in Base Ten, Numbers and Operations—Fractions, Measurement and Data, and Geometry.

Topics covered in poster set include:

-Place value

-Rounding

-Comparing numbers

-Fraction basics

-Fractions vocabulary

-Equivalent fractions

-Comparing fractions

-Adding fractions

-Subtracting fractions

-Decomposing fractions

-Mixed numbers

-Improper fractions

-Adding mixed numbers

-Subtracting mixed numbers

-Multiplying fractions

-Decimal basics

-Addition and subtraction of whole numbers

-Multiplication comparison statements

-Multiplication

-Division

-Divisibility rules

-Factors and multiples

-Prime and composite numbers

-Patterns

-Geometry vocabulary

-Angles

-Polygons

-Triangles

-Quadrilaterals

-Symmetry

-Perimeter and area

-Customary measurements

-Metric measurements

Total Pages
33 pages
Answer Key
Does not apply
Teaching Duration
N/A
Report this resource to TPT
Reported resources will be reviewed by our team. Report this resource to let us know if this resource violates TPT’s content guidelines.

Standards

to see state-specific standards (only available in the US).
Tell and write time to the nearest minute and measure time intervals in minutes. Solve word problems involving addition and subtraction of time intervals in minutes, e.g., by representing the problem on a number line diagram.
Measure and estimate liquid volumes and masses of objects using standard units of grams (g), kilograms (kg), and liters (l). Add, subtract, multiply, or divide to solve one-step word problems involving masses or volumes that are given in the same units, e.g., by using drawings (such as a beaker with a measurement scale) to represent the problem.
Draw a scaled picture graph and a scaled bar graph to represent a data set with several categories. Solve one- and two-step “how many more” and “how many less” problems using information presented in scaled bar graphs. For example, draw a bar graph in which each square in the bar graph might represent 5 pets.
Generate measurement data by measuring lengths using rulers marked with halves and fourths of an inch. Show the data by making a line plot, where the horizontal scale is marked off in appropriate units-whole numbers, halves, or quarters.
Recognize area as an attribute of plane figures and understand concepts of area measurement.

Reviews

Questions & Answers