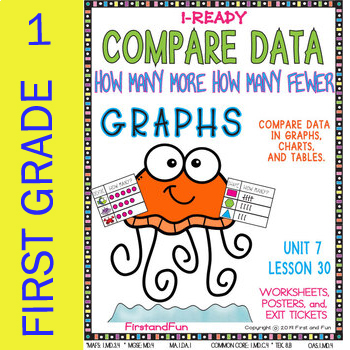
GRAPHS COMPARE OBJECTS HOW MANY MORE HOW MANY LESS UNIT 7 LESSON 30 READY MAF
- PDF
- Easel Activity
What educators are saying
Also included in
- You can save by downloading this bundle instead of the individual packs. They are bundled by unit and include all lessons contained in that unit.This is extra practice for i Ready Math First as well as any other First or Second Grade math curriculum. This product is NOT endorsed by Curriculum AsPrice $20.00Original Price $23.00Save $3.00
- You can save by downloading this bundle instead of the individual packs. They are bundled by unit and include all lessons contained in that unit. This Bundle contains ALL Extra Practice Packs for the ENTIRE year! All 35 Lessons are included.This is extra practice for i Ready Math First Grade as welPrice $88.00Original Price $112.50Save $24.50
Description
First Grade
TALLY GRAPHS AND PICTURE GRAPHS
Product Description
This math pack is a great addition to any Math Curriculum for first grade. This product has extensive practice for students who are learning to understand how sort and compare object, how to read complete tally and picture graphs. There are 32 DIFFERENTIATED worksheets total. 22 are practice sheets, 10 are exit tickets, and 7 of which have answer keys. The Exit Tickets come with “I Can Statements” The Exit tickets have answer keys, which can be placed at a Math Center. It includes 2 strategy posters.
This product will make it easier for students to understand the basics of COMPARING DATA, How many less, how many more, the most, the least in the graph.
This is extra practice for i Ready Math First as well as any other First or Second Grade math curriculum.
This file is an independent product and is not affiliated with, nor has been authorized, sponsored, or otherwise approved by Pearson®, Always Learning®, Scott Foresman®, Pearson Scott Foresman®, or enVisionMath®, Curriculum Associates®.
ALSO AVAILABLE IN MY STORE ARE:
UNITS 1: Lessons 1 through Lesson 5,
UNIT 2: Lessons 6 through Lesson 11,
UNIT 3, Lesson 12 through Lesson 16,
UNIT 4, Lesson 17 through Lesson 20
UNIT 5, Lesson 21 through Lesson 25
UNIT 6, Lesson 26 through Lesson 28
UNIT 7, Lesson 29 through Lesson 30
I am working on Unit 7 next, Lessons 31 - 35
There will be MORE Units AND Lessons to come...
Look for the bundles of each unit, to save money.
Standards:
MATH STANDARDS:
MAFS: 1.MD.3.4 * MGSE: MD.4 MA.1.DA.1 COMMON CORE: 1.MD.C.4 * TEK. 8.B OAS.1.MD.4 1.MD.4
Remember this is intended for one classroom only. If you enjoy my product please consider following me on Teacher Pay Teachers store and rate my down load.
Please email me if you have any question. I can adjust any part of the product to meet the needs of your students.
svrdesign@earthlink.net
If by any chance you find an error, please contact me directly at the email above. I will show express my gratitude with a free product.
**Remember to leave feedback to earn your TPT Credits!**


