TPT
Total:
$0.00

Functions Word Wall

Rated 5 out of 5, based on 7 reviews
5.0 (7 ratings)
;
Sine of Success
159 Followers
Grade Levels
8th - 9th
Standards
Formats Included
  • PDF
$2.00
$2.00
Share this resource
Report this resource to TPT
Sine of Success
159 Followers

What educators are saying

These printed very nicely and fit perfectly on my word wall for my functions unit. The writing is big enough that students can see what it says from far away
Also included in
  1. 8th Grade Word Wall - FULL BUNDLECreate or update your math word wall with 132 terms and formulas on the following concepts:Expressions and EquationsTransformationsAngles and TrianglesLinear Equations & Systems of EquationsFunctionsExponents and Scientific NotationPythagorean TheoremArea & V
    Price $17.50Original Price $22.10Save $4.60

Description

8th Grade Word Wall

Functions

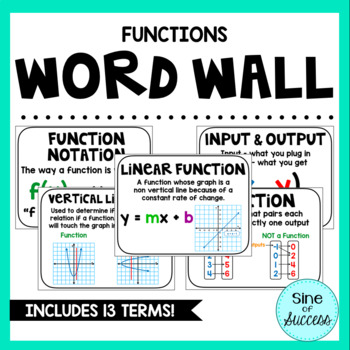
Create or update your math word wall with these 13 terms:

  • Coordinate Plane
  • Ordered Pair
  • Input & Output
  • Independent Variable
  • Dependent Variable
  • Relation
  • Mapping Diagram
  • Function
  • Function Rule
  • Function Notation
  • Vertical Line Test
  • Linear Function
  • Nonlinear Function

Just print and hang up! You can build your word wall throughout the year, or switch out terms as needed!

TIP: I laminate my word wall terms and put a magnetic strip on the back. I hang them on a spare whiteboard in my room, making hanging super easy!


Check out my other word walls!

6th Grade Numerical Expressions Word Wall

6th Grade Expressions & Equations

6th Grade Area & Surface Area

7th Grade Expressions & Equations Word Wall

7th Grade Percents Word Wall

7th Grade Ratios & Proportions Word Wall

7th Grade Integers & Rational Numbers Word Wall

7th Grade Inequalities Word Wall

7th Grade Area, Volume, & Surface Area Word Wall

7th Grade Percents Word Wall

7th Grade Polygons & Scale Drawings Word Wall

7th Grade Word Wall FULL BUNDLE

8th Grade Word Wall FULL BUNDLE

8th Grade Expressions and Equations Word Wall

8th Grade Transformations Word Wall

8th Grade Angles and Triangles Word Wall

8th Grade Linear Equations & Systems Word Wall

8th Grade Functions Word Wall

8th Grade Exponents and Scientific Notation Word Wall

8th Grade Pythagorean Theorem Word Wall

8th Grade Area and Volume Word Wall

8th Grade Scatter Plots and Data Displays Word Wall

Or take a look at my other resources at my TpT store, Sine of Success

This resource was created using fonts from KG Fonts and MTF Fonts!

Total Pages
Answer Key
N/A
Teaching Duration
N/A
Report this resource to TPT
Reported resources will be reviewed by our team. Report this resource to let us know if this resource violates TPT’s content guidelines.

Standards

to see state-specific standards (only available in the US).
Understand that a function is a rule that assigns to each input exactly one output. The graph of a function is the set of ordered pairs consisting of an input and the corresponding output.
Compare properties of two functions each represented in a different way (algebraically, graphically, numerically in tables, or by verbal descriptions). For example, given a linear function represented by a table of values and a linear function represented by an algebraic expression, determine which function has the greater rate of change.
Interpret the equation 𝘺 = 𝘮𝘹 + 𝘣 as defining a linear function, whose graph is a straight line; give examples of functions that are not linear. For example, the function 𝘈 = 𝑠² giving the area of a square as a function of its side length is not linear because its graph contains the points (1,1), (2,4) and (3,9), which are not on a straight line.
Construct a function to model a linear relationship between two quantities. Determine the rate of change and initial value of the function from a description of a relationship or from two (𝘹, 𝘺) values, including reading these from a table or from a graph. Interpret the rate of change and initial value of a linear function in terms of the situation it models, and in terms of its graph or a table of values.
Describe qualitatively the functional relationship between two quantities by analyzing a graph (e.g., where the function is increasing or decreasing, linear or nonlinear). Sketch a graph that exhibits the qualitative features of a function that has been described verbally.

Reviews

Questions & Answers

159 Followers