TPT
Total:
$0.00

Functions Unit Bundle - 8.F.1, 8.F.2, 8.F.3, 8.F.4, 8.F.5 {EDITABLE}

Rated 4.82 out of 5, based on 17 reviews
4.8 (17 ratings)
;
Math in the Midwest
2.3k Followers
Grade Levels
8th - 9th, Homeschool
Subjects
Standards
Formats Included
  • Zip
Pages
150+
$14.99
List Price:
$20.00
You Save:
$5.01
$14.99
List Price:
$20.00
You Save:
$5.01
Share this resource
Report this resource to TPT
Math in the Midwest
2.3k Followers

Description

Functions Unit Bundle (Math 8 Curriculum - Unit 6)

This bundle contains Power Point presentations, notes, homework, review activities, quizzes, a practice unit test, unit test and answer keys that cover the following topics:

Topics Covered:

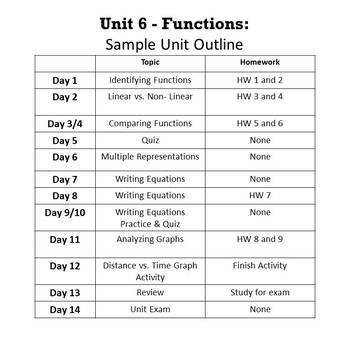
  • Identifying Functions
  • Linear vs. Non Linear
  • Comparing Functions
  • Multiple Representations
  • Writing Equations
  • Analyzing Graphs

What's Included?

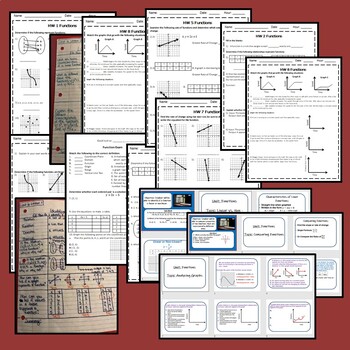
  • 5 Power Point Presentations
  • 9 Homework Assignments
  • 4 Completed Note Examples
  • Multiple Representation Graph Organizer
  • Station Review
  • Distance vs. Time Graph Activity
  • Jeopardy Review
  • Practice Unit Exam
  • Unit Exam
  • Answer Keys

This unit is EDITABLE . I have included a PDF file for easy printing and also a file in PowerPoint if you would like to edit any of the documents.

Please download the preview to see a sample outline

NO PREP Functions Escape Room - 8th Grade Math

***************************************************************************

Escape Room Bundles:

GOOGLE RESOURCES:

PRINTABLE (PAPER) RESOURCES:

ULTIMATE BUNDLES:

*********************************************

Go to my store Math in the Midwest to see all my other products. Don't forget to follow me for notifications of new products, updates, freebies, and great deals!


Total Pages
150+
Answer Key
Included
Teaching Duration
2 Weeks
Report this resource to TPT
Reported resources will be reviewed by our team. Report this resource to let us know if this resource violates TPT’s content guidelines.

Standards

to see state-specific standards (only available in the US).
Understand that a function is a rule that assigns to each input exactly one output. The graph of a function is the set of ordered pairs consisting of an input and the corresponding output.
Compare properties of two functions each represented in a different way (algebraically, graphically, numerically in tables, or by verbal descriptions). For example, given a linear function represented by a table of values and a linear function represented by an algebraic expression, determine which function has the greater rate of change.
Interpret the equation 𝘺 = 𝘮𝘹 + 𝘣 as defining a linear function, whose graph is a straight line; give examples of functions that are not linear. For example, the function 𝘈 = 𝑠² giving the area of a square as a function of its side length is not linear because its graph contains the points (1,1), (2,4) and (3,9), which are not on a straight line.
Construct a function to model a linear relationship between two quantities. Determine the rate of change and initial value of the function from a description of a relationship or from two (𝘹, 𝘺) values, including reading these from a table or from a graph. Interpret the rate of change and initial value of a linear function in terms of the situation it models, and in terms of its graph or a table of values.
Describe qualitatively the functional relationship between two quantities by analyzing a graph (e.g., where the function is increasing or decreasing, linear or nonlinear). Sketch a graph that exhibits the qualitative features of a function that has been described verbally.

Reviews

Questions & Answers

2.3k Followers