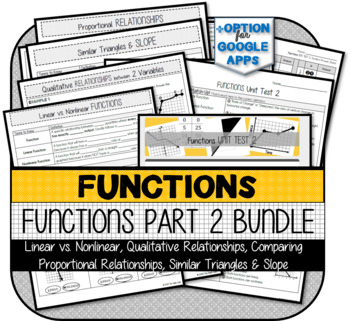
Functions Part 2 MINI-BUNDLE
- Zip
Products in this Bundle (14)
showing 1-5 of 14 products
Bonus
Also included in
- NOTE: Google Apps Options - Only the ASSESSMENTS and a few other specified activities have Google Apps options. This bundle is NOT ideal for "Distance Learning" unless you have special access to PDF editors that remove answer keys, etc.This product includes:1) Notes2) Practice3) Games4) Activities5)Price $68.00Original Price $89.00Save $21.00
- Does your state have additional standards that are not included in this resource? Email me at tptmathcafe@gmail.com for supplemental resourcesNOTE: Google Apps Options - Only the ASSESSMENTS and a few other specified activities have Google Apps options. This curriculum is NOT ideal for "Distance LeaPrice $175.00Original Price $272.99Save $97.99
Description
This resource contains NOTES, ACTIVITIES, TEST PRACTICE, & ASSESSMENTS (Quizzes + Unit Test) for the following topics:
1) Linear vs. Nonlinear Functions
2) Comparing & Interpreting Proportional Relationships
3) Qualitative Relationships between Two Variables
4) Similar Triangles & Slope
All Assessments come in both a printable version & version for Google Forms.
You can download each item as needed or download the full .zip file in which files are organized according to recommended use.
This resource was developed to assess the requirements of the 8th Grade Expressions & Equations and Functions Standards below:
CCSS.MATH.CONTENT.8.F.A.3 Interpret the equation y = mx + b as defining a linear function, whose graph is a straight line; give examples of functions that are not linear. For example, the function A = s2 giving the area of a square as a function of its side length is not linear because its graph contains the points (1,1), (2,4) and (3,9), which are not on a straight line.
CCSS.MATH.CONTENT.8.F.B.5 Describe qualitatively the functional relationship between two quantities by analyzing a graph (e.g., where the function is increasing or decreasing, linear or nonlinear). Sketch a graph that exhibits the qualitative features of a function that has been described verbally.
CCSS.MATH.CONTENT.8.EE.B.5 Graph proportional relationships, interpreting the unit rate as the slope of the graph. Compare two different proportional relationships represented in different ways. For example, compare a distance-time graph to a distance-time equation to determine which of two moving objects has greater speed.
CCSS.MATH.CONTENT.8.EE.B.6 Use similar triangles to explain why the slope m is the same between any two distinct points on a non-vertical line in the coordinate plane; derive the equation y = mx for a line through the origin and the equation y = mx + b for a line intercepting the vertical axis at b.
LICENSING TERMS: This purchase includes a license for one teacher only for personal use in their classroom. Licenses are non-transferable, meaning they can not be passed from one teacher to another. No part of this resource is to be shared with colleagues or used by an entire grade level, school, or district without purchasing the proper number of licenses.
COPYRIGHT TERMS: This resource may not be uploaded to the internet in any form, including classroom/personal websites or network drives, unless the site is password protected and can only be accessed by students.


