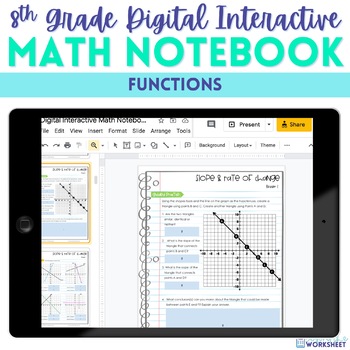
Functions Digital Interactive Notebook for 8th Grade Math Curriculum
- Zip
- Google Apps™

Also included in
- ⭐️⭐️⭐️ Explore this my comprehensive 8th Grade Math Curriculum in a Digital Interactive Format! ✅ Unlock an Engaging and Interactive Math Learning Experience:This digital interactive notebook version of the 8th Grade Curriculum takes your students on a journey through essential 8th Grade Math skills inPrice $109.99Original Price $154.72Save $44.73
Description
This resource takes my 8th Grade Linear and Functional Relationships Unit and turns it into an interactive, Google Slides Notebook.
Some questions have been modified to fit the format - allowing for drag and drop, matching, etc.
CLICK HERE for a free sample of one of the 6th grade digital notebooks.
Skills included:
- Slope and Rate of Change
- Properties of Linear and Functional Relationships
- Graphing Linear Functions from Tables
- Writing, Using and Graphing with Slope-Intercept Form
- Linear Relationships in Real-Life
Resources Included:
- Standards alignment and common misconceptions for each skill
- Google slides (53) notebook
- Google forms assessments
- Audio buttons to allow students to have definitions read to them.
This resource is available in the following bundle(s):
8th Grade Digital Interactive Notebook Bundle
Licensing Terms :
By purchasing this product, you own a license for one teacher only for personal use in their own classroom. Licenses are non-transferable and therefore can not be passed from one teacher to another. If the teacher who purchased this license leaves the classroom or changes schools, the license and materials leave with that teacher. No part of this resource is to be shared with colleagues or used by an entire team, grade level, school or district without purchasing the correct number of licenses. If you are a coach, principal or district interested in transferable licenses that would accommodate yearly staff changes, please contact me for a transferable license quote at lindsayperro@gmail.com.
Copyright Information :
© Lindsay Perro. Please note - all material included in this resource belongs to Lindsay Perro Inc. By purchasing, you have a license to use the material but you do not own the material. You may not upload any portion of this resource to the internet in any format, including school/personal websites or network drives unless the site is password protected and can only be accessed by students, not other teachers or anyone else on the internet.
✮✮If you are interested in gaining access to an exclusive set of free resources,CLICK HERE.


