Finding Slope from a Graph Activity - Self Checking Digital Google Sheets
4 the Love of Math
6.6k Followers
Resource Type
Standards
CCSS8.EE.B.5
CCSS8.EE.B.6
CCSSHSF-IF.B.6
CCSSHSF-LE.A.1
CCSSMP1
Formats Included
- PDF
- Google Apps™
4 the Love of Math
6.6k Followers

Includes Google Apps™
The Teacher-Author indicated this resource includes assets from Google Workspace (e.g. docs, slides, etc.).
Description
Looking for a way to help students master finding slope from a graph in a way that provides them with instant feedback? This self-checking finding slope from a graph activity in Google Sheets is the answer. Put those bulky, time-consuming answer keys aside; this sheet will make life a whole lot easier!
Why Use this Finding Slope from a Graph Activity:
- No Prep: No need to spend precious time preparing - this finding slope activity is ready to go, saving you valuable time.
- Self-Checking: Students receive instant feedback, reducing the need for manual grading and allowing them to take charge of their own learning.
- Easy to Use: The user-friendly format ensures that both students and teachers can navigate it with ease.
How to Use this Finding Slope from a Graph Activity:
- Share this Google Sheets finding slope activity with your students
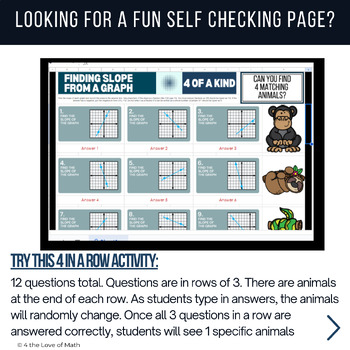
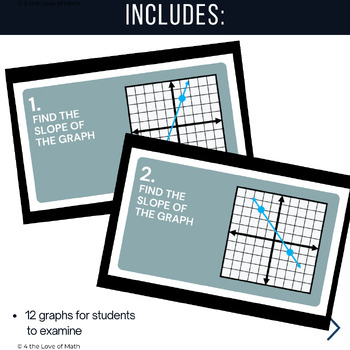
- Students will see 12 question cards, each displaying a graph with a line drawn. Students determine the slope and type it in the answer box. As they type in their answers, watch as animal pictures randomly swap around.
- Challenge your students to determine the slopes of the three lines in each sequence correctly. When they achieve this, the animals in that row will stop rotating, revealing a specific animal.
- When all four rows show the same surprise animal, students will know they have correctly answered all question!
Included is a detailed question/answer page showcasing all question boxes and their correct slopes, ensuring you're fully equipped to guide your students.
Ease your teaching burden, empower your students with instant feedback, and make finding slope a breeze. If you have any questions, feel free to reach out to us at randi@4theloveofmath.com.
Total Pages
Answer Key
Included
Teaching Duration
N/A
Report this resource to TPT
Reported resources will be reviewed by our team. Report this resource to let us know if this resource violates TPT’s content guidelines.
Standards
to see state-specific standards (only available in the US).
CCSS8.EE.B.5
Graph proportional relationships, interpreting the unit rate as the slope of the graph. Compare two different proportional relationships represented in different ways. For example, compare a distance-time graph to a distance-time equation to determine which of two moving objects has greater speed.
CCSS8.EE.B.6
Use similar triangles to explain why the slope m is the same between any two distinct points on a non-vertical line in the coordinate plane; derive the equation 𝘺 = 𝘮𝘹 for a line through the origin and the equation 𝘺 = 𝘮𝘹 + 𝘣 for a line intercepting the vertical axis at 𝘣.
CCSSHSF-IF.B.6
Calculate and interpret the average rate of change of a function (presented symbolically or as a table) over a specified interval. Estimate the rate of change from a graph.
CCSSHSF-LE.A.1
Distinguish between situations that can be modeled with linear functions and with exponential functions.
CCSSMP1
Make sense of problems and persevere in solving them. Mathematically proficient students start by explaining to themselves the meaning of a problem and looking for entry points to its solution. They analyze givens, constraints, relationships, and goals. They make conjectures about the form and meaning of the solution and plan a solution pathway rather than simply jumping into a solution attempt. They consider analogous problems, and try special cases and simpler forms of the original problem in order to gain insight into its solution. They monitor and evaluate their progress and change course if necessary. Older students might, depending on the context of the problem, transform algebraic expressions or change the viewing window on their graphing calculator to get the information they need. Mathematically proficient students can explain correspondences between equations, verbal descriptions, tables, and graphs or draw diagrams of important features and relationships, graph data, and search for regularity or trends. Younger students might rely on using concrete objects or pictures to help conceptualize and solve a problem. Mathematically proficient students check their answers to problems using a different method, and they continually ask themselves, "Does this make sense?" They can understand the approaches of others to solving complex problems and identify correspondences between different approaches.


