Finding Slope From a Graph Digital Matching Pages
- PDF
- Google Apps™
- Easel Activity

What educators are saying
Description
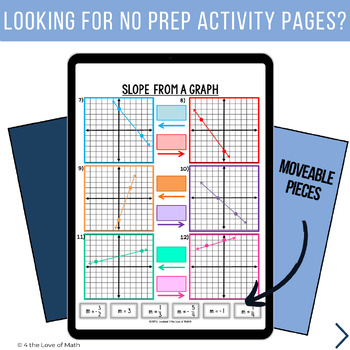
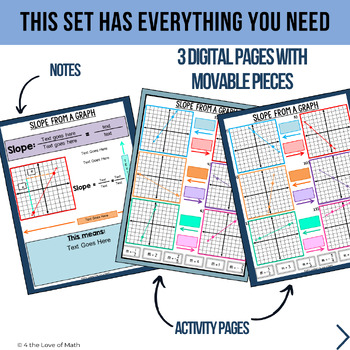
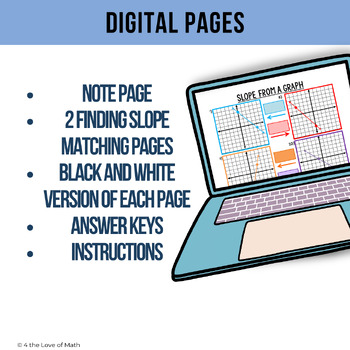
Teaching slope can be a challenge. These finding slope worksheets make finding the slope of a line from a graph easy and fun for students. 3 digital pages, a variety of problems, along with an answer key to make this easy to grade.
The first page is a quick review on finding slope from a graph. The second and third pages each have 6 graphs with lines drawn on them. At the bottom of the pages are 6 slopes. Students must match the slope to the graph by dragging each slope to its correct box. There is also a black and white printable version of these pages at the end of the document that can be used as needed!
Pages pages are for use on chrome books, tablets, or any other device that uses Google apps. The digital pages are paperless and do not require any cutting, printing, or gluing! Students work on a device to move objects to the appropriate spots on the page.
Check out the preview to see the activity in action!
If you have any questions, comments, suggestions, or requests please do not hesitate to email me at: randi@4theloveofmath.com
Thank you!
*****************************************************************************
Check out these other Digital resources:
Digitally Interactive Resources
*****************************************************************************
Terms of use:
This item is a paid digital download. As such, it is for use in one classroom (or by one teacher) only. This item is bound by copyright laws and redistributing, editing, selling, or posting this item (or any part thereof) on the Internet beyond the scope of the Google classroom are all strictly prohibited without first gaining permission from the author. Violations are subject to the penalties of the Digital Millennium Copyright Act.
*****************************************************************************


