Favorite Sports Team: Data Displays and Measures of Central Tendency Project
cmb
130 Followers
Grade Levels
5th - 8th
Subjects
Resource Type
Formats Included
- Word Document File
Pages
6 pages
cmb
130 Followers
Description
Students will create a poster using sports statistics. Depending on the time of year, you may want to use football scores, basketball scores, data from the Olympics, etc. Students will use the internet (or you can print out statistics for them) to find sports data.
The students really buy into this project because it is about something they are interested in - their favorite sports team!
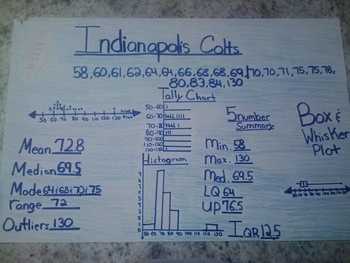
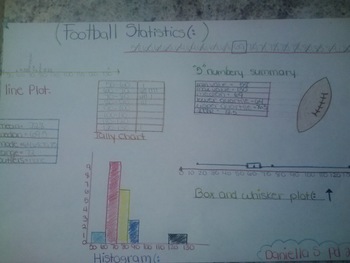
Students will display their knowledge of several data displays: line plot, tally chart, histogram and box and whisker plot (with 5 number summary) They will also calculate the measures of central tendency: mean, median, mode, range and outliers. You can even add an extension (or extra credit) to this project by having the students take out the outlier and explain how it affects the data. If you are studying different types of displays (bar graph, circle graph, pictograph, line graph, etc. you may change the project to fit your needs. As the teacher, you may pick and choose which graphs you want the students to display.
If you have an advanced group of students (or you want the students to work collaboratively) you may compare two sports teams on a single poster using double line graph, double bar graph, 2 box and whisker graphs, etc.
Students will work out the graphs as a “rough draft” on the template provided and then transfer them to their poster. The template gives them plenty of workspace to show their work and create the graphs.
I have had some students go all out and decorate their poster beautifully! They wanted to keep their posters and hang them in their room.
Included in this product: 2 student examples of a completed project, template for the students to create graphs and figure measures of central tendency, rubric and direction sheet for the students, direction sheet for the teacher.
Total Pages
6 pages
Answer Key
Rubric only
Teaching Duration
3 days
Report this resource to TPT
Reported resources will be reviewed by our team. Report this resource to let us know if this resource violates TPT’s content guidelines.


