TPT
Total:
$0.00

Graphing Linear Equations Picture Activity | Graphing Lines Worksheet

Rated 4.74 out of 5, based on 60 reviews
4.7 (60 ratings)
23,485 Downloads
;
8th Grade Math Teacher
3k Followers
Grade Levels
7th - 9th
Subjects
Standards
Formats Included
  • PDF
Pages
8 pages
8th Grade Math Teacher
3k Followers

Description

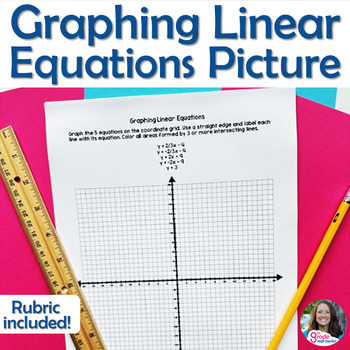
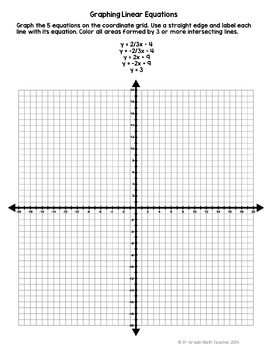
Great practice for graphing lines! This quick assignment gives 5 linear equations and a coordinate grid. Students graph the 5 lines, and when intersected, the lines form a simple star that they color. An optional rubric is included.


There are 2 versions are given. Choose if you want:

•all equations in slope-intercept form

OR

•equations in both slope-intercept form or standard form


Use this as a quick formative assessment or as a mini project! All students need is a copy of this resource, a ruler, and some colored pencils.


What's included:

  • 2 versions of the Graphing Linear Equations Assignment
  • Optional rubric (with or without point values)
  • Answer Key

Ways to use this resource:

•Give this resource to students as an assignment for practice.

•Have this resource on hand for early finishers.

•Have students cut out the star when finished and write “I’m a graphing super star!” to hang as decoration around the room.

•Create a large “slope tree” on chart paper. Add a student’s star to the top during the holidays.

•Have students change one part of an equation or two and graph the lines to see how it affects the image of the star.


This is the perfect resource for 8th grade math when students are learning how to graph equations of lines, but can easily be used with 7th grade students as an extension or with Algebra students as review.

Click here to follow me!

You may also like...

Gingerbread House Slope Activity

Linear Equations Patterns Activities

Slope-Intercept Form Game

8th Grade Math Posters for Word Wall
7th Grade Math Posters for Word Wall

6th Grade Math Vocabulary

7th Grade Math Vocabulary

8th Grade Math Vocabulary

Total Pages
8 pages
Answer Key
Included
Teaching Duration
30 minutes
Last updated Apr 6th, 2014
Report this resource to TPT
Reported resources will be reviewed by our team. Report this resource to let us know if this resource violates TPT’s content guidelines.

Standards

to see state-specific standards (only available in the US).
Graph proportional relationships, interpreting the unit rate as the slope of the graph. Compare two different proportional relationships represented in different ways. For example, compare a distance-time graph to a distance-time equation to determine which of two moving objects has greater speed.
Understand that solutions to a system of two linear equations in two variables correspond to points of intersection of their graphs, because points of intersection satisfy both equations simultaneously.
Interpret the equation 𝘺 = 𝘮𝘹 + 𝘣 as defining a linear function, whose graph is a straight line; give examples of functions that are not linear. For example, the function 𝘈 = 𝑠² giving the area of a square as a function of its side length is not linear because its graph contains the points (1,1), (2,4) and (3,9), which are not on a straight line.

Reviews

Questions & Answers