
Exponential Growth and Decay Worksheets with Real World Stories


- PDF
- Google Apps™

What educators are saying
Also included in
 Do you love discovery learning, collaboration, hands-on activities, and projects that help students make sense of the math they are learning? This curriculum is packed with engaging and challenging Algebra I and 8th grade math resources for the whole year. A variety of activities, inquiry learningPrice $350.00Original Price $677.94Save $327.94
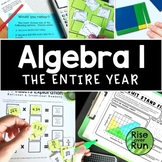 This curriculum bundle includes a variety of activities, assessments, games, group activities, projects, inquiry lessons, guided notes, and more for teaching Algebra I CCSS standards. The activities are centered on discovery learning and engaging activities with real world connections. Lessons helpPrice $225.00Original Price $445.21Save $220.21
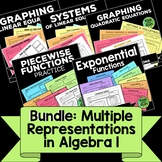 Practice graphing linear functions, systems of linear equations, quadratic functions, exponential functions, and piecewise functions with these engaging activity sheets.Each resource contains multiple task sheets. Each task asks students to complete a story, graph, table of values, and equation basPrice $20.00Original Price $33.00Save $13.00
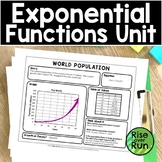 Engage students in Algebra 1 with this activity and inquiry based unit. Students will discover and apply exponential functions in real world contexts. The lessons included are standards-based, rigorous, and not boring! All of the included resources are in printable format. Some also have digital vePrice $15.00Original Price $21.50Save $6.50
Description
Explore exponential functions with multiple representations with these activity task sheets. Students fill in the missing information by completing a story, equation, graph, and table of values. Then they answer questions and identify if the function is exponential growth or decay.
The worksheets are included in a printable version and a digital version for Google Slides.
Topics include population growth and decay, investing money, multiple discounts, ball bounce heights, and chain text messages.
These are great to use for partner work, individual practice, or assessments. The eighth sheet is a blank template, so students can create their own exponential functions.
What’s included:
- Printable Activity Sheets: 7 worksheets with multiple representations of real world exponential relationships for students to complete missing information.
- Digital Google Slides Version: Same real world relationships for students to complete using Google Slides
- Create Your Own: Printable and Google Slides sheet for students to create their own
- Answer Keys
These activities are an excellent way to practice math word problems.
